
Figure 7.
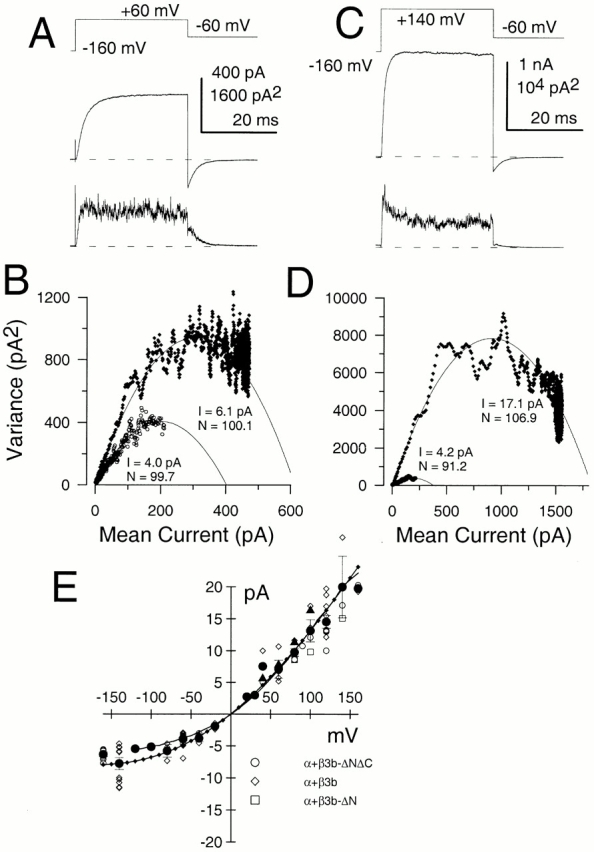
Ensemble variance analysis reveals nonlinearity in single-channel current estimates. In A, the indicated voltage protocol was used to repeatedly activate α + β3b-ΔNΔC currents with 10 μM Ca2+. The top current trace shows the average current from 75 sweeps, while the bottom trace shows the variance of all current values around the mean. In B, the current variance was plotted as a function of mean current at +60 mV (♦) and during repolarization to −60 mV (○). The initial slope of the variance versus mean relationship is steeper at +60 mV, indicative of a larger single-channel current amplitude. The solid lines are fits of in the materials and methods, where N and i are the fitted values for number of channels and single-channel current, respectively. At +60 mV, N = 100.1 and i = 6.1 pA, whereas at −60 mV, N = 99.7 and i = 4.0 pA. In C, mean current and variance determined for 90 sweeps are shown for the same patch with currents activated by a step to +140 mV with 10 μM Ca2+. In D, at +140 mV (♦), N = 106.9 and i = 17.1, whereas, at −60 mV (○), N = 91.2 with i = 4.2 pA. Currents were sampled at 5 μs per point at a bandwidth of 10 kHz. At +140 mV, the ensemble variance analysis would suggest that average open probability for these channels at 10 μM Ca2+ was 0.85, whereas at +60 mV, the average open probability was 0.79. These values are generally consistent with the near maximal activation of conductance observed in Fig. 3 D for the α + β3b-ΔN currents at +60 mV. In E, estimates of average open channel current obtained by different methods are plotted as a function of voltage. Open symbols correspond to individual ensemble variance analysis estimates. Values were obtained from α + β3b-ΔNΔC (○), α + β3b (⋄), and α + β3b-ΔN (□) currents, with no obvious differences among constructs. Mean values (•, and SD) for all variance analysis estimates for the three constructs were also determined at each potential. Mean values were calculated based on 2–16 estimates at each potential. The plot also includes estimates (▴) of single-channel current amplitude from the amplitude histograms shown in Fig. 6. The solid line is an instantaneous I-V curve for the α + β3b-ΔN currents (see Fig. 9 A in Lingle et al. 2001, in this issue) with the values normalized to the single-channel current value at +100 mV. The line with diamonds corresponds to the function: I(V) = V · G/(1 + K(0)exp−zFV/RT), with G = 173 pS, K(0) = 0.7 and z = 0.2, suggesting a limiting single-channel conductance of 173 pS.