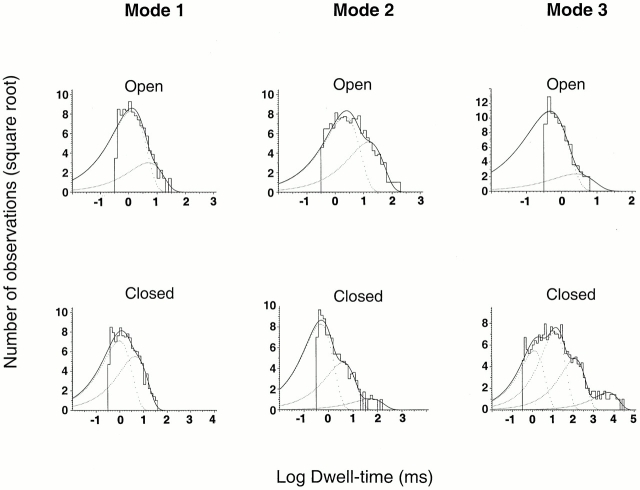
Figure 11.
Dwell-time histograms of open and closed events corresponding to modes 1, 2, and 3. A long record from a single channel activated by pHo 4.0, containing 50,000 events was analyzed for moving mean Po calculated with 100 successive open and close intervals. We assigned to mode 1 segments of the record with Po 0.5 ± 0.05, to mode 2 Po > 0.6, and to mode 3 Po < 0.1. Events from each mode were pooled and used to construct histograms of open and closed events. (mode 1) The distributions of open times were fitted with the sum of two exponential components with parameters (mean time constant, with the relative area shown in parentheses): 1.24 ms (0.88) and 4.94 ms (0.11). The distributions of closed times were fitted with the sum of two exponential components: 0.98 ms (0.62) and 4.5 ms (0.37). (mode 2) Distributions of open times: 2.24 ms (0.69) and 15.14 ms (0.31). Distributions of closed times were fitted with three exponential components: 0.48 ms (0.76), 3.87 ms (0.23), and 51.2 ms (0.13). (mode 3) Distributions of open times: 0.46 ms (0.94) and 2.0 ms (0.055). Distributions of closed times were fitted with four exponential components: 1.24 ms (0.28), 13 ms (0.48), 121.8 ms (0.21), and 5,209 ms (0.024).

