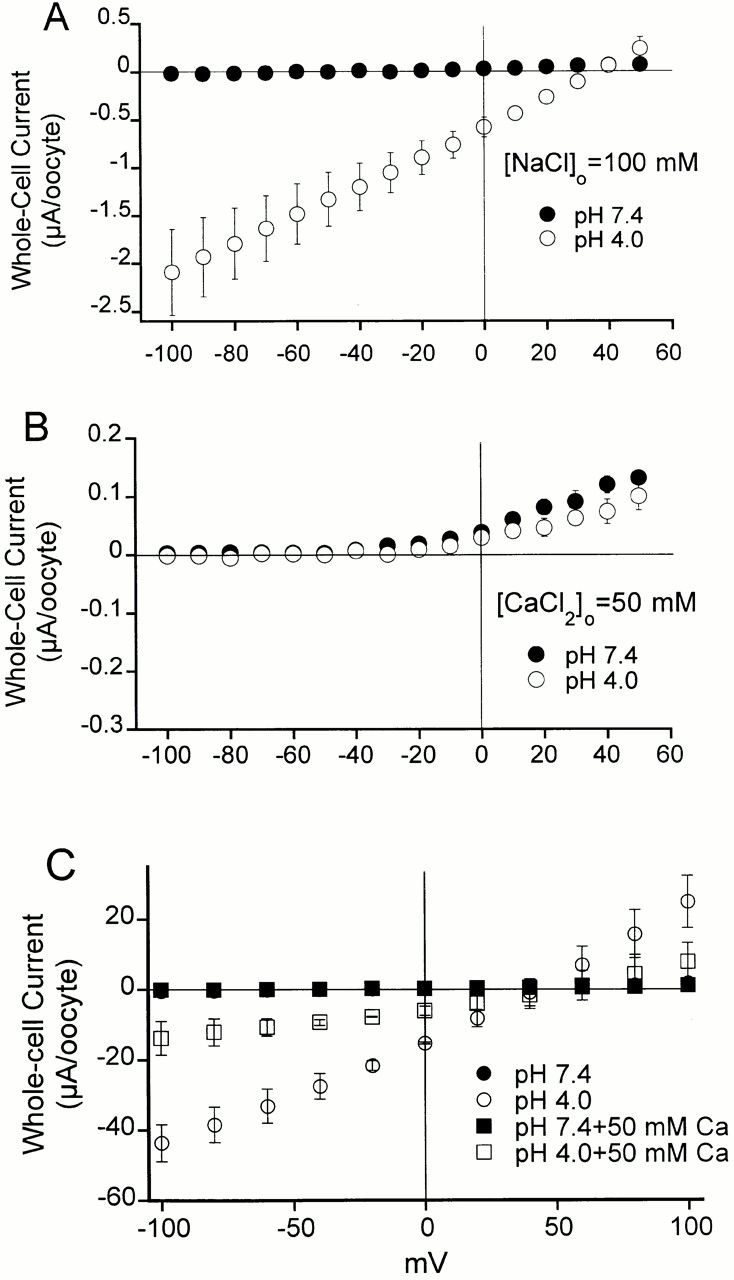
Figure 4.

Mean I-V relationships of whole-cell currents from oocytes expressing ASIC2-3 measured with a two-electrode voltage clamp. (A) The external solution contains 100 mM NaCl buffered at pH 7.4 or 4.0; voltage range of membrane potential was −100 to 50 mV. (B) The external solution contains 50 mM CaCl2 without Na+, buffered to pH 7.4 or 4.0; voltage range of membrane potential was −100 to 50 mV. Notice the change in the scale of the vertical axis. Inward and outward currents become very small in the absence of Na+, and the symbols representing the currents at pHo 7.4 and 4.0 are almost superimposed. (C) The external solution contains 100 mM NaCl and 50 mM Ca2Cl buffered at pH 7.4 or 4.0. At pHo 7.4, no currents are detected; black squares and circles are superimposed. To better observe the effect of Ca2+ on both inward and outward currents, the voltage range of the membrane potential was expanded from −150 to 100 mV. Each data point is the mean of three to four oocytes ±SD.
