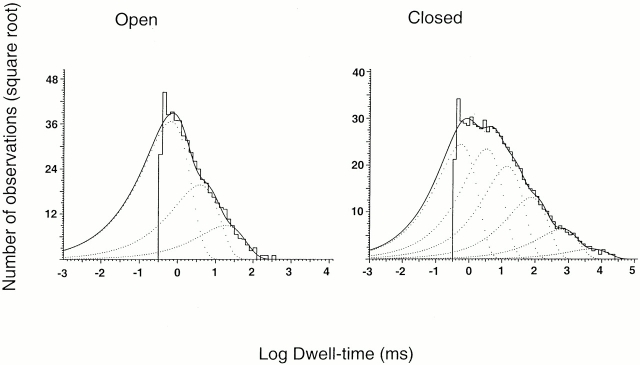
Figure 7.
Dwell-time histograms of open and closed events collected from three outside-out patches activated with pHo 5.0. Lines represent the fit of the data of open events with three exponentials. Mean time constant (relative area shown in parentheses) are as follows: 0.66 ms (0.74), 3.9 ms (0.21), and 19 ms (0.05). The closed events were fitted with the following six exponential components: 0.55 ms (0.34), 3.3 ms (0.31), 14 ms (0.21), 75 ms (0.08), 606 ms (0.04), and 4880 ms (0.02).

