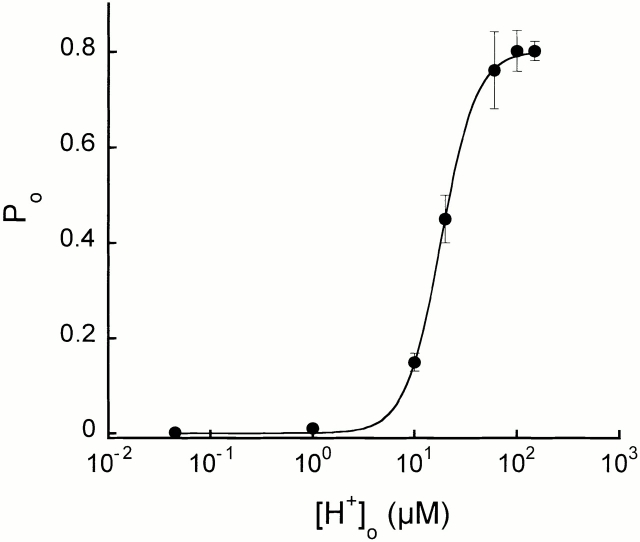
Figure 8.
External proton dose–response curve. Open probability of ASIC2-3 was plotted for each increment of [H+]o. Fit of the data to the Hill equation is shown the in solid line. The calculated values were as follows: EC50 = 16 μM, Hill coefficient = 2.7, and maximum Po = 0.8. Symbols represent the mean Po obtained from at least 10,000 open and closed events. For some of the points, two to three patches activated by the same pHo were combined to have sufficient number of events for the analysis.

