
Figure 2.
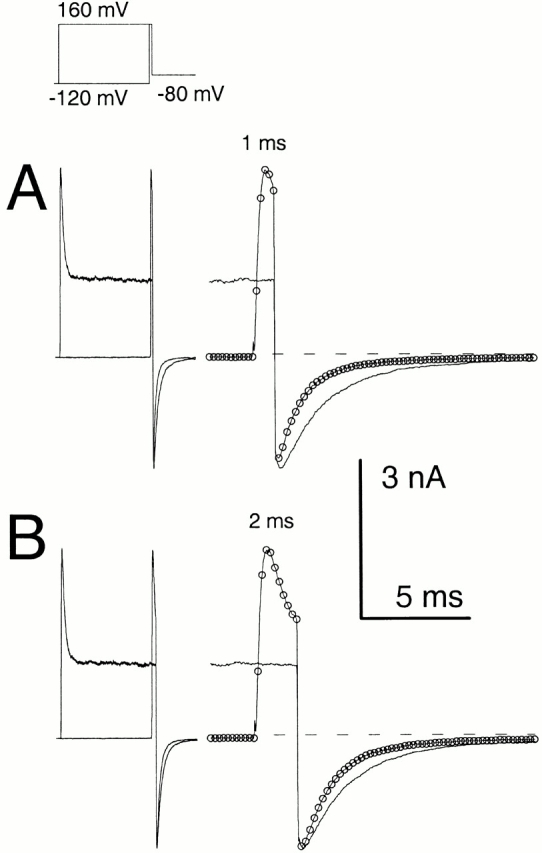
α + β3b currents rapidly recover from inactivation. Currents through α + β3b channels were activated in the presence of 10 μM Ca2+ by the voltage protocol shown on the top. Scale bars apply to the expanded time base traces displayed on the right. In A, traces compare tail currents after repolarization to −80 mV at the end of either a 1- or 40-ms step to +160 mV. The left traces show the complete current record, whereas the right-hand traces show the tail currents on an expanded time base. Despite the fact that outward current at the end of the 1-ms step to +160 is more than twice that at the end of the 40-ms step to +160 mV, maximal tail current amplitude after repolarization is actually larger in the latter case. Furthermore, the current decay time is markedly slower. For currents activated with the brief steps to +160 mV, symbols plot every twentieth digitized point. In B, tail currents at −80 mV are compared after either a 2-ms or a 40-ms step to +160 mV. The tail current amplitude is similar in both cases despite the fact that outward current at +160 mV differs markedly.