
Figure 3.
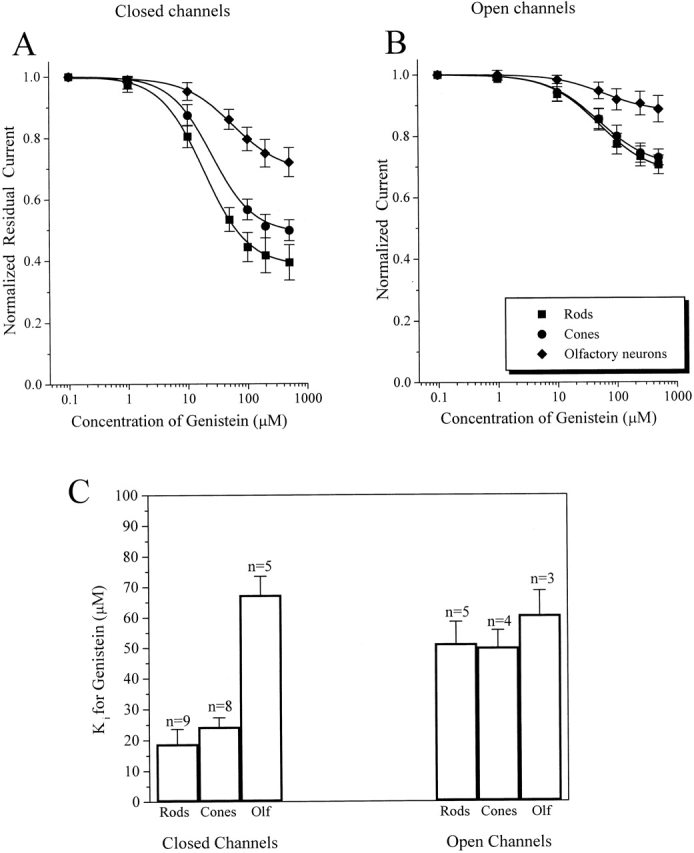
Comparison of genistein inhibition of native CNG channels. Dose-inhibition curves of the effect of genistein on native closed (A) and fully activated (B) CNG channels from rod and cone outer segments and olfactory receptor neurons. Continuous curves in A and B show fits of the data to the Hill equation (see materials and methods). (C) Bar graph showing K i values for genistein inhibition of closed and activated channels from rods, cones, and olfactory neurons. Data represents mean ± SEM for all of the individual experiments included in A and B.