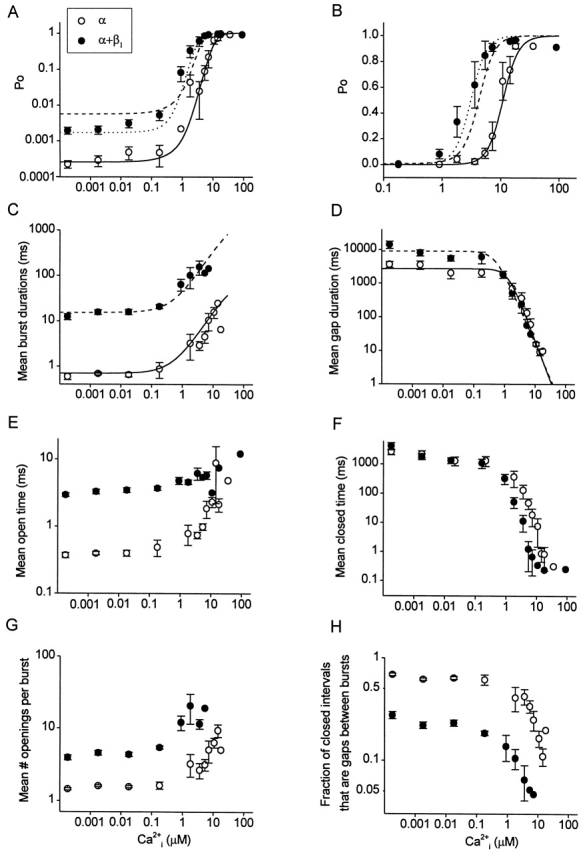
Figure 2.

Effects of the β1 subunit on the gating parameters from 0 to high levels of Ca2+ i. Data is plotted for α channels (○) and α+β1 channels (•). The lack of effect of Ca2+ i on the parameters from 0.00018 to 0.018 μM Ca2+ i indicates that effective 0 Ca2+ i was achieved in this range. (A and B) Plots of P o vs. Ca2+ i on double logarithmic and semilogarithmic coordinates. (Continuous lines) Calculated P o for α channels with using the continuous line in C for burst and the continuous line in D for gaps. (Dashed lines) Calculated P o for α+β1 channels with using the dashed line in C for burst and the continuous line in D for gap. The assumption that the β1 subunit increased burst duration 22-fold in a Ca2+-independent manner accounted for 80% of the leftward shift in the P o vs. Ca2+ i plot. (Dotted lines) Calculated P o for α+β1 channels with using the dashed line in C for burst and the dashed line in D for gap. 100% of the shift could be accounted for by also including the smaller Ca2+-dependent effect of the β1 subunit on the duration of the gaps between bursts. (C) Plot of mean burst duration versus Ca2+ i. The burst duration of α channels (continuous line) was described by the empirical expression: Yα(burst) = 0.7 + 100/[1 + (50/X)^1.1], where X is Ca2+ i in micromolar and burst duration is in milliseconds. Multiplying this line by a constant factor of 22 then described the burst duration of α+β1 channels (dashed line). (D) Plot of the mean duration of gaps between bursts versus Ca2+ i. The continuous line for α channels is given by the empirical equation: Yα(gap) = 2,700{1 −1/[1 + (1.3/X)^2.4]}, and the dashed line for α+β1 channels is given by: Yα+β(gap) = 9,000{1 −1/[1 + (0.5/X)^2.1]}, where X is Ca2+ i in micromolar and gap duration is in milliseconds. (E–H) Plots of the indicated parameters versus Ca2+ i. For all parts of the figure, the data for α channels are from 15 patches containing 1–12 channels per patch, and the data for α+β1 channels are from 21 patches containing 1–13 channels per patch. Data from multichannel patches were used only in 0 or very low Ca2+ i, when the P o was sufficiently low that the bursts did not overlap. Parameters from multichannel patches were corrected for the numbers of channels in each patch, as specified in methods. Data are plotted as the mean ± SEM.
