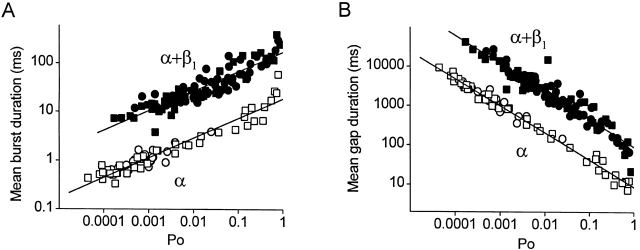
Figure 6.
The β1 subunit-induced increase in both burst and gap duration is independent of P o and whether the channel is activated by voltage or Ca. (A) Plot of mean burst duration versus P o. (B) Plot of the mean durations of gaps between bursts versus P o. Data in each plot are presented for α channels (open symbols) and for α+β1α+β1 channels (filled symbols). P o was changed by changing Ca2+ i at the same membrane potential of +30 mV (circles), or by changing the membrane potential in the absence of Ca2+ i (squares). Data are from the same patches detailed in the legends of Fig. 2 and Fig. 4.

