
Figure 6.
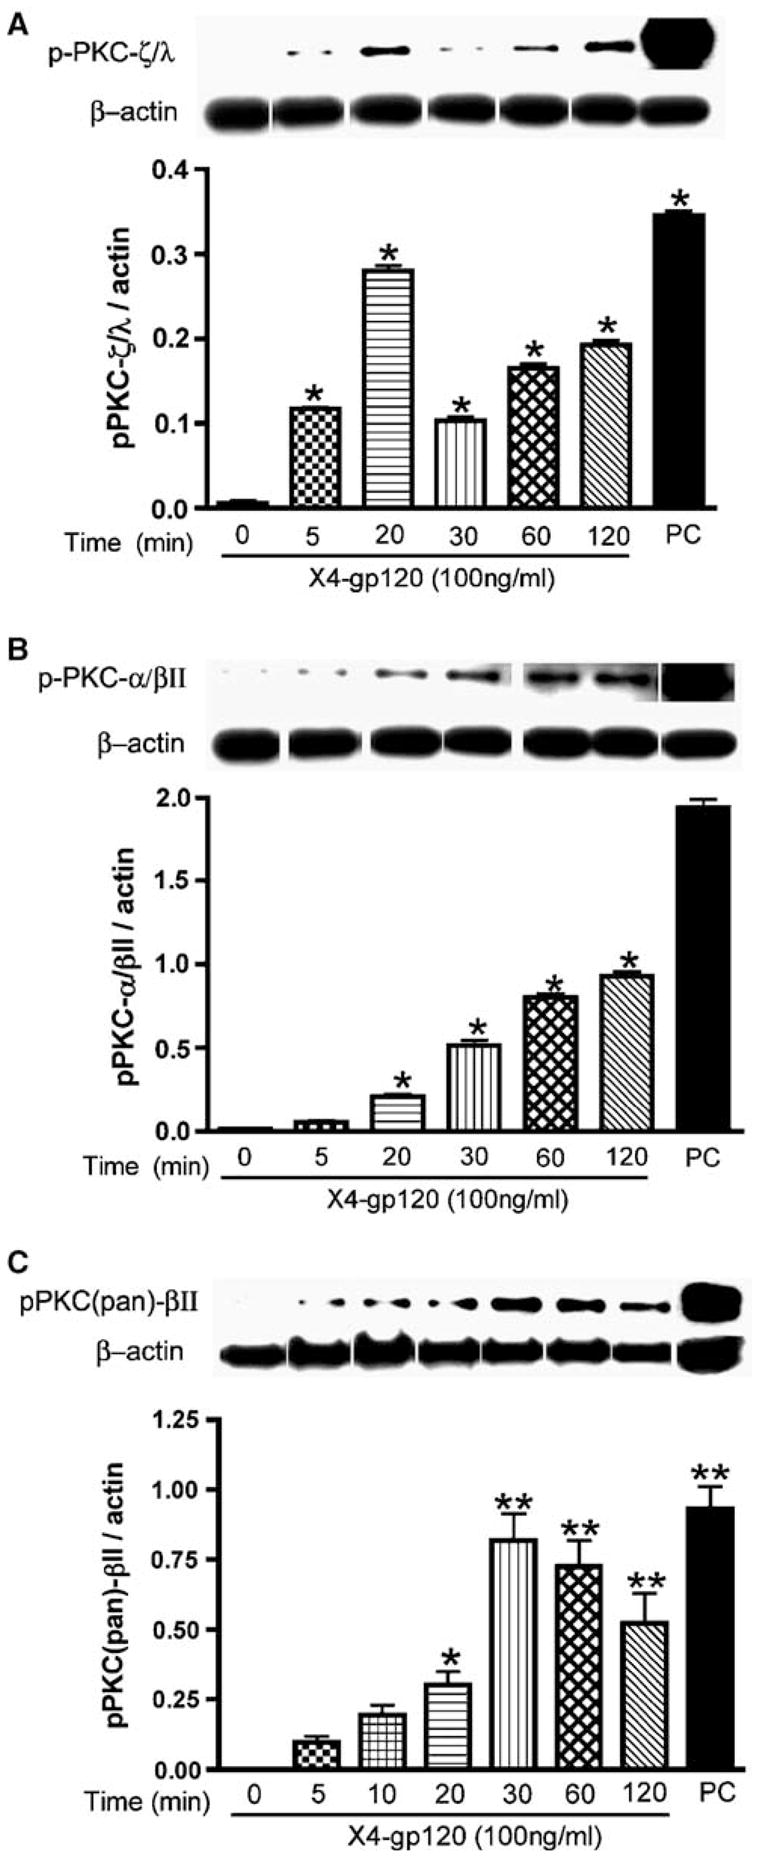
Exposure of HBMECs to X4 gp120 induced PKC phosphorylation. PhosphoPKC-ζ/λ (Thr638/641) (A), PKC-α/βII (Thr638/641) (B) and PKC(pan)-βII (Ser660) (C) were detected with respective antibodies. Following Western blot analysis with phospho-PKC each blot was stripped and probed with β-actin antibody. Relative intensity was expressed as ratio of arbitrary volume integrated densitometric units of the target protein to that of β-actin. Results are expressed as mean values ±s.e.m. (n = 3) (*P < 0.01, **P < 0.001, compared to 0-h control). Positive controls (PC) were protein extracts from rat cerebrum.