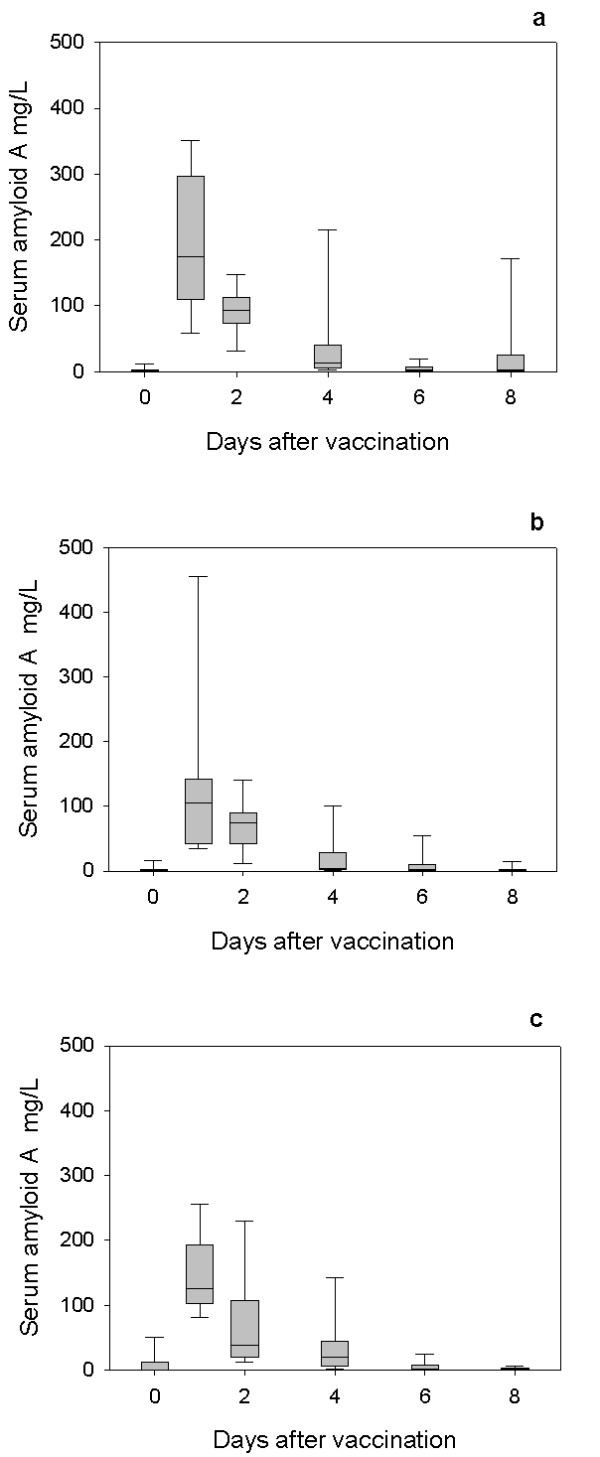
Figure 4.

SAA response to secondary vaccination with Heptavac. The concentrations of serum amyloid A in lambs (n = 10) following the second vaccination with Heptavac. The maternal diets of the lambs were High/High (a), High/Low (b) and Low/High (c). The plots show the median as the line in the box, the 25th and 75th percentile are represented by the box with the whiskers representing the 10th and 90th percentiles.
