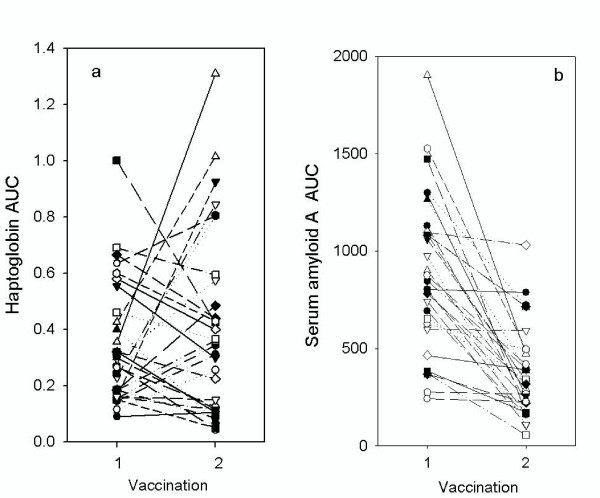
Figure 6.
Area under the curve of APP responses to primary and secondary vaccinations in individual lambs. The area under the curve calculated for haptoglobin (a) and serum amyloid A (b) for lambs following the first (1) and second (2) vaccination with Heptavac. Each symbol and line represents samples taken from the individual lambs at each vaccination.

