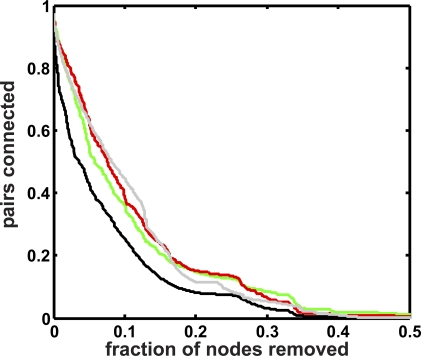
Figure 9. Modularity Analysis for the Yeast Protein–Protein Interaction Network with Topological Clustering.
Fraction of pairs of genes that remain connected upon removal of nodes with the highest betweenness centrality, for the highly curated yeast protein–protein interaction network and synthetic lethal and dosage rescue pairs of Reguly et al. [18]. Red line, synthetic lethal pairs; green, dosage rescue pairs; black solid line, random pairs; grey line, random pairs of the randomized network.

