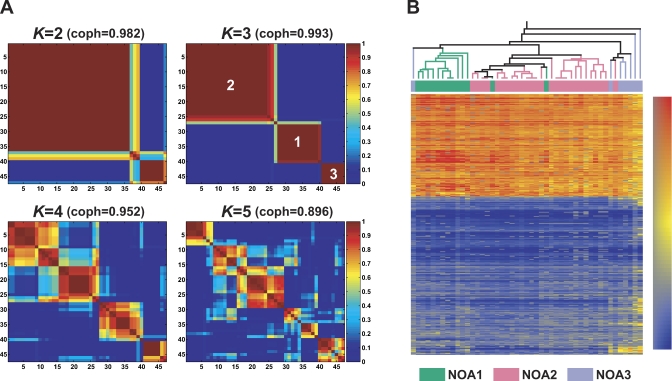
Figure 3. Non-Negative Matrix Factorization (NMF) and Hierarchical Clustering (HC)-based Subclassification of 47 NOA Samples.
(A) Reordered consensus matrices averaging 50 connectivity matrices computed at K = 2–5 (as the number of subclasses modeled) for the NOA data set comprising of NOA-related target genes. NMF computation and model selection were performed according to Brunet et al. [6] as described in Materials and Methods. According to cophenetic correlation coefficients (coph) for NMF-clustered matrices, the NMF class assignment for K = 3 was the most robust.
(B) The HC method incorporated in GeneSpring also was used to classify NOA heterogeneity in testicular gene expression. To display correspondences of subclassification by the two methods, the NMF class assignments for K = 3 are shown color-coded; NOA1 (green), NOA2 (pink), and NOA3 (light purple).

