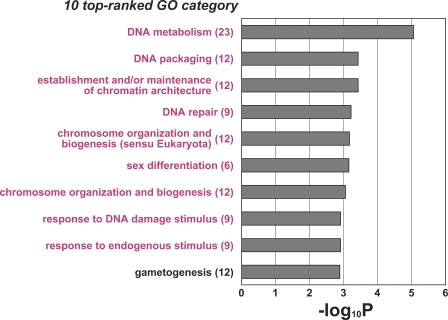
Figure 4. Significant Enrichments of Gene Ontology Categories in GO-based Profiling of 149 Differentially Expressed Transcripts.
Grey bars represent p-values (expressed as the negative logarithm [base 10]) for the 10 top-ranked GO categories over-represented in the 149 differentially expressed transcripts, using the 2,611 NOA-related target transcripts as a background set of genes for the determination of p-values. The actual number of differentially expressed transcripts involved in each category is given in parentheses. In the process of extracting the 149 transcripts from the NOA-related target gene list, sets of genes involved in nine GO categories, marked in magenta, were more condensed because they were not found in the previous 10 top-ranked GO lists of NOA-related target genes (see Table 1 and Figure 2).

