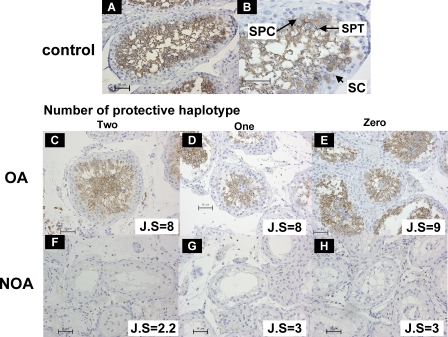
Figure 8. Immunohistochemical Analysis of ART3 Expression in Human Testes.
Representative seminiferous tubules in testicular sections from normal controls (A, B), OA (C–E), and NOA patients (F–H) are shown. Arrows indicate spermatocytes (SPC); spermatids (SPT); and Sertoli cells (SC) (B). ART3 protein was immunostained with anti-ART3 antibody; ART3-positive spermatocytes (SPC) are noted as brown staining cells (A–E). No marked differences in testicular ART3 expression among the three ART3 diplo-groups carrying none, one, or two copies of the protective haplotype H1were observed in OA (C–E) and NOA (F–H) patients. Magnification is 60× except in (B) (120×).

