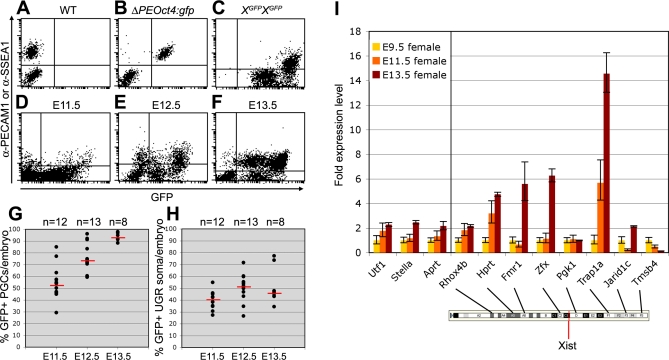
Figure 5. Xi Reactivates in XX PGCs between E11.5 and E13.5.
(A,B) FACS-analysis of XX E13.5 WT (A) and ΔPEOct4:gfp (B) PGCs show that anti-PECAM1 is a suitable antibody to separate PGCs from the surrounding somatic tissue. Anti-SSEA1 was used to separate XX E11.5 and E12.5 PGCs from the surrounding somatic tissue.
(C) FACS-analysis of XX E13.5 XGFP homozygous genital ridges containing 100% GFP-positive cells, used as positive control.
(D–F) Representative dot-plots showing FACS-analysis of XX E11.5 (D), E12.5 (E), and E13.5 (F) genital ridges from individual Xp-XGFP embryos.
(G,H) The percentage of FACS-analysed GFP-expressing PGCs (G) and surrounding somatic tissue (H) in the genital ridges of individual XX E11.5, E12.5, and E13.5 Xp-XGFP embryos. PGCs and somatic cells were respectively positive and negative for SSEA1 (E11.5, 12.5) or PECAM1 (E13.5). Red bars depict the median, n is the total number of embryos analysed.
(I) Transcriptional levels of X-coded genes and autosomal genes at E9.5, E11.5, and E13.5. Shown are the relative transcription levels of each gene compared to the expression of that same gene observed at E9.5. The localization of the X-coded genes analysed and Xist are shown on the cartoon of the X chromosome (from Ensembl).

