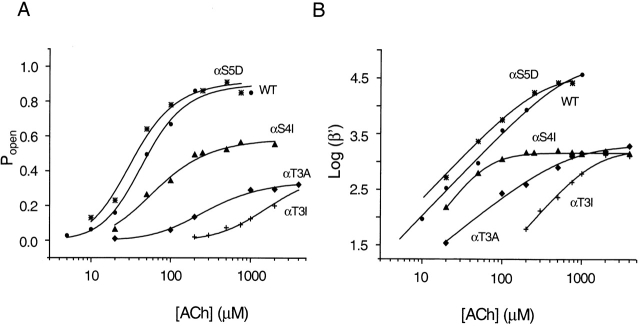
Figure 5.
Equilibrium concentration–response curves for wild-type and representative M2–M3L mutant AChRs in the presence of ACh. (A) Intracluster P open as a function of ACh concentration was fitted with . (B) The effective opening rate (β′) as a function of ACh concentration was fitted with . (•) wild type, (*) αS5D, (▴) αS4I, (♦) αT3A, (+) αT3I.

