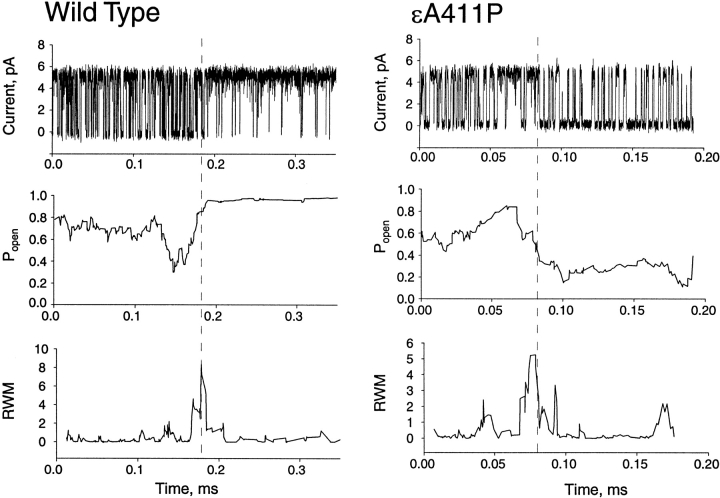
Figure 7.
Abrupt kinetic switches occur within individual AChR activation episodes. Each trace is an individual activation episode from either wild-type or εA411P AChR. The graphs below plot open probability for groups of 10 openings plus 10 closings across the activation episode. The lower graphs plot the relative window mean (RWM) computed for consecutive 10-event windows across the activation episode (Milone et al. 1998): RWM = {log[(τopenwindow1 × τclosedwindow2)/τopenwindow2 × τclosedwindow1]}2. The peak in the RWM plot reveals the time of the mode switch (vertical dashed lines).

