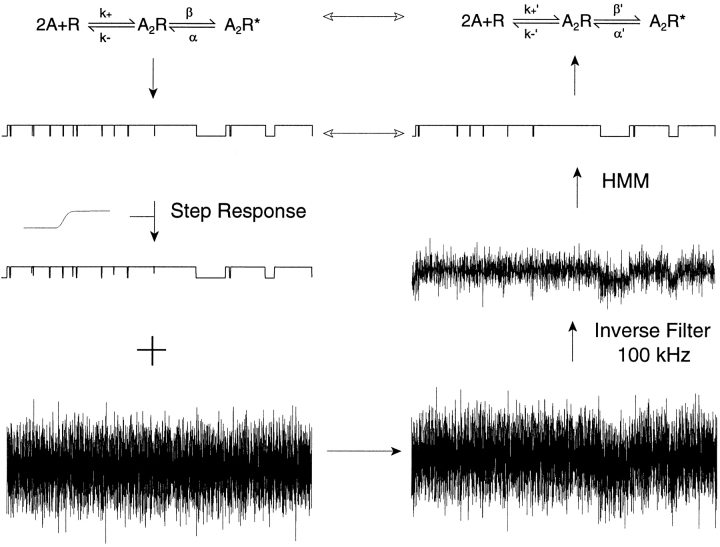
Figure 9.
Overview of HMM analysis applied to simulated data. Idealized channel events are generated using Fig. 1 (top, left), and the intervals digitized (1 MHz); the system step response is added to each conductance transition, noise from a quiescent segment of recording is added, the signal is inverse filtered and decimated to produce an effective bandwidth of 100 kHz, and HMM detects conductance transitions and produces a set of fitted Fig. 1 rate constants (k+′, k−′, β′, α′) that is compared with the input values.

