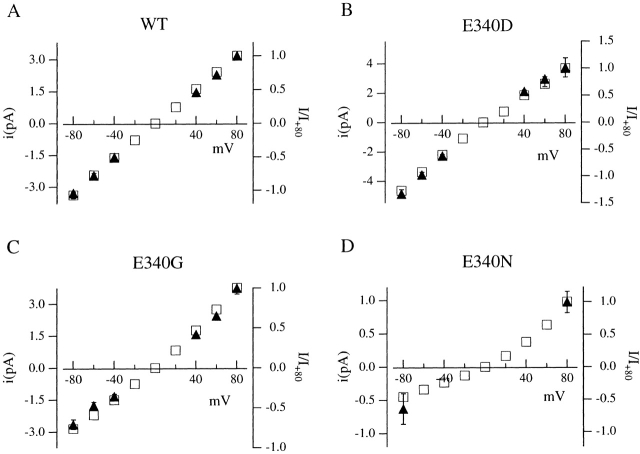
Figure 4.
Comparison of normalized I-V relations from macroscopic and single-channel currents for wild-type and mutant channels. Macroscopic currents were measured at saturating cGMP in a voltage range from −80 to + 80 mV and normalized to unity at +80 mV. Average values of normalized macroscopic currents (□) and of single-channel amplitudes (▴) were plotted versus applied voltage. Each point is the average from at least four patches. Bars indicate standard deviation. Error bars smaller than the size of the symbols were not plotted.

