
Figure 4.
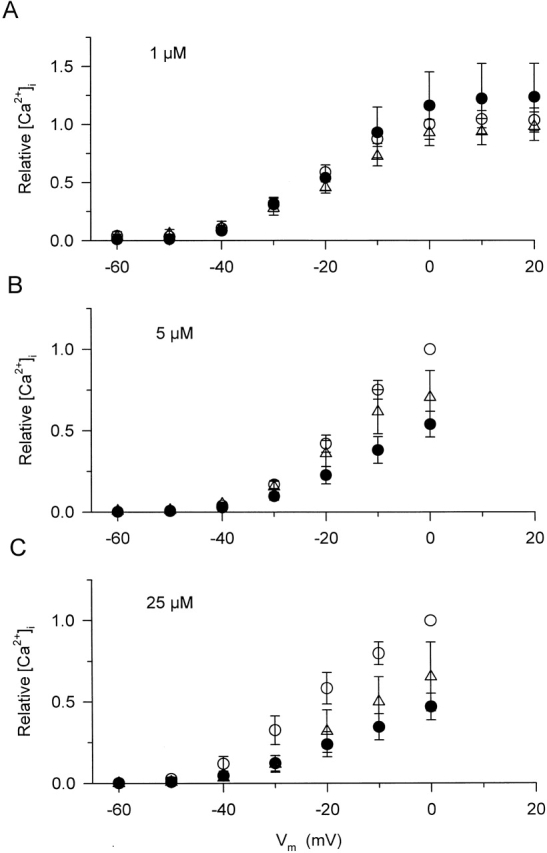
Voltage dependence of the peak of the calcium transients at different dantrolene concentrations. Measurements in each fiber and at each dantrolene concentration were taken as described in Fig. 3, first in control conditions (○), and then in the presence of the drug (•). Additionally, dantrolene was removed from the external solution before obtaining a final set of calcium transients (washout, Δ). To ease the comparison between different fibers and dantrolene concentrations, the peak [Ca2+]i for every transient in a given fiber was normalized to the value measured under control conditions at 0 mV in the given fiber. The average values for the peak of [Ca2+]i at 0 mV were 1.5 ± 0.3 (n = 13), 1.8 ± 0.3 (n = 7), and 1.6 ± 0.3 μM (n = 9) for A–C, respectively. Depolarizations to or below −70 mV did not elicit any measurable increase in [Ca2+]i and were not included in the graph. Note that the scale in A is different from that in B and C.