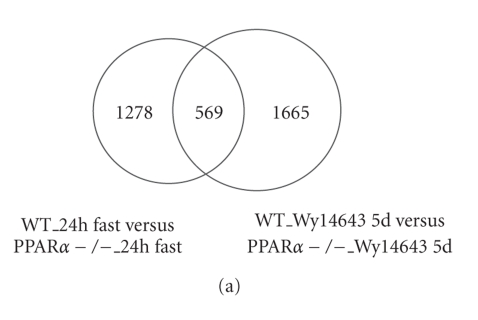
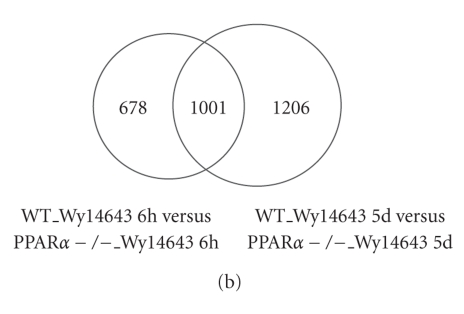
Figure 1.
Microarray analysis of PPAR-dependent gene regulation in mouse liver. (a) Venn diagram showing the number of differentially expressed probesets between livers of 24-hour fasted wild-type and PPAR-null mice, and between wild-type and PPAR-null mice treated with the PPAR agonist Wy14643 for 5 days. Pooled RNA was hybridized to Affymetrix MOE430A arrays. A fold-change of was used as cutoff. (b) Venn diagram showing the number of differentially expressed probesets between livers of wild-type and PPAR-null mice treated with the PPAR agonist Wy14643 for 6 hours, and between wild-type and PPAR-null mice treated with the PPAR agonist Wy14643 for 5 days. RNA from individual mice was hybridized to mouse 430 2.0 arrays. Probesets that satisfied the criteria of fold-change and FDR were considered to be significantly regulated.


