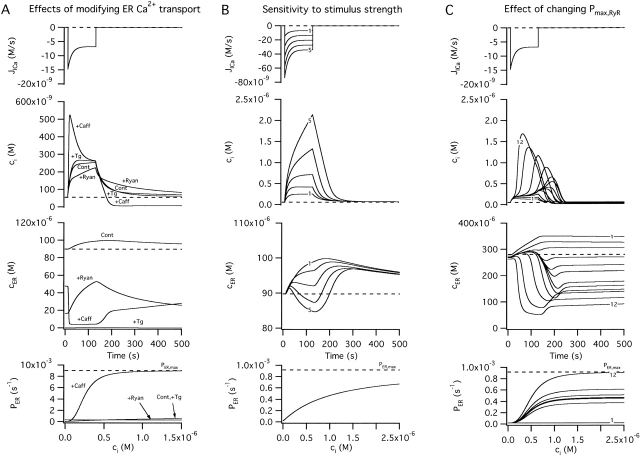
Figure 5.
Simulated changes in ci and cER induced by Ca2 + entry. A–C illustrate simulated effects of Ca2+ entry (top row) on the concentrations of cytosolic Ca2+ (ci, second row) and intraluminal Ca2+ (cER, third row); bottom row shows how the total Ca2+ permeability of the internal pool depends on ci. Components of the net Ca2+ flux across the plasma membrane (JICa, Jextru) and of the net ER Ca2+ flux (JSERCA, JRelease) are defined in the and illustrated in Fig. 7. (A) Simulated responses under four conditions that can be compared with results described in this study. Under control conditions (Cont), Ca2+ entry increases ci but at a rate that is attenuated by Ca2+ accumulation, which causes cER to rise from a high basal level. After inhibiting the uptake pathway (+Tg), cER remains low and ci increases more rapidly during stimulation than in the control. After inhibiting CICR and increasing Pbasal to model the effects of ryanodine (+Ryan), ci rises more slowly and cER rises more rapidly from a lower resting level. Finally, after increasing the maximal rate of CICR and its ci sensitivity (+Caff), the rise in ci triggers net Ca2+ release so that cER declines and the ci rise is accelerated, leading to a transient ci overshoot. For the control response, kleak= 1.5 × 10⁻⁷ s−1 co = 2 mM, Vmax,extru = 25 nM/s, EC50,extru = 386 nM, nextru = 2.4, Vmax,SERCA = 70 nM/s, EC50,SERCA = 700 nM, nSERCA = 1, Pbasal = 1.78 × 10⁻⁵ s−1, Pmax,RyR = 9 × 10⁻⁴ s−1, EC50,RyR = 1 μM, nRyR = 1 and γER = 0.01. To simulate responses after treatment with Tg, Vmax,SERCA was set to zero while all other parameters had their control values. To simulate responses in the presence of ryanodine, Pmax,RyR was set to zero and Pbasal was increased to 3 × 10⁻⁴ s−1. To simulate the effects of caffeine, Pmax,RyR was increased to 9 × 10⁻³ s−1, EC50,RyR was reduced to 250 nM, and nRyR was increased to 3. Ca2+ entry was represented by fitting a triple exponential function to a representative JICa measurement obtained during a 40 s depolarization and extrapolating in time; tail currents were not included. (B) Simulated responses elicited by stimuli of increasing strength (curves 1–5) using control parameters from A. (C) Simulated responses to a fixed stimulus illustrating the effect of increasing the ci-sensitive permeability, Pmax,RyR (curves 1–12) with EC50,RyR = 500 nM and nRyR = 3. The effect of these changes on total permeability (PER) is shown at bottom.

