
Figure 3.
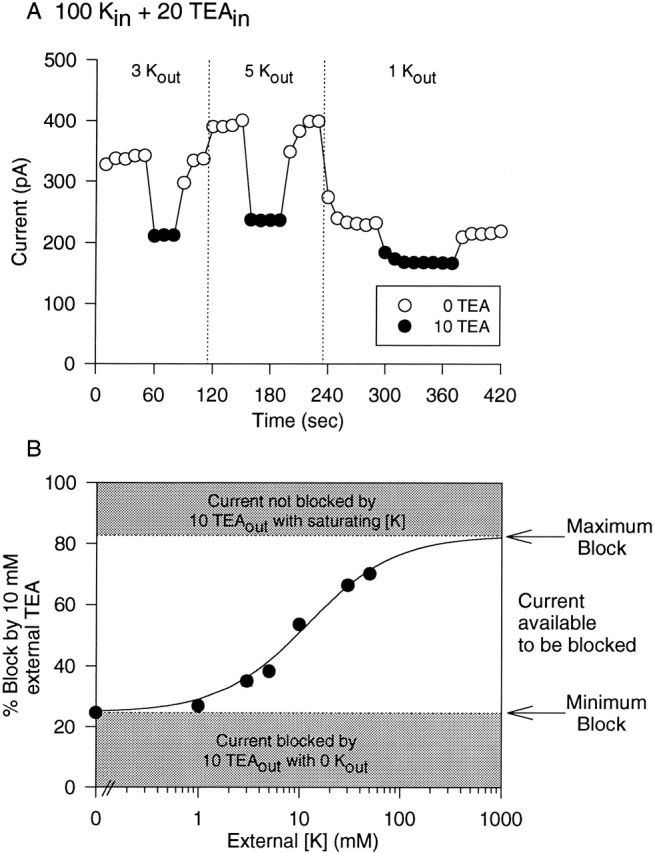
External [K+] dependence of external TEA block in the presence of internal TEA. Outward currents were recorded as in Fig. 2, with 100 mM internal K+ plus 20 mM internal TEA. Block by 10 mM external TEA was examined in the presence of different external [K+]. (A) Data obtained from a single cell, where block by 10 mM TEA was examined sequentially in the presence of 3, 5, and 1 mM external K+. Currents were evoked every 10 s; • denote current magnitude in the presence of TEA. External [K+] was changed (vertical dotted line) after washout of external TEA and return to steady state current magnitude. (B) Block by 10 mM external TEA as a function of external [K+]. The shaded area at the bottom of the graph represents the minimum block by 10 mM TEA in the presence of 100 mM internal K+ plus 20 mM internal TEA, which occurs in the absence of external K+ (Fig. 2). This percent block represents the fraction of TEA modulation sites already occupied in the absence of external K+. The shaded area at the top represents the maximum possible block by 10 mM TEA, obtained when the channel is saturated by K+ (Fig. 1, 100 K+ in, 50 K+ out). When all TEA modulation sites are occupied, 83% of current will be blocked by 10 mM TEA. The remaining, unshaded area of the graph (between 25 and 83% block) represents the percentage of current that is available to be blocked by 10 mM TEA when current is carried by 100 mM K+ in in the presence of 20 mM internal TEA. This represents current through channels with an unoccupied TEA modulation site. The best fit of the data points (three to seven cells for each point) indicates that, under these conditions, the apparent affinity of external K+ for the site responsible for increasing external TEA block from minimum to maximum is 10.8 ± 1.1 mM (slope = 1.0).