
Figure 3.
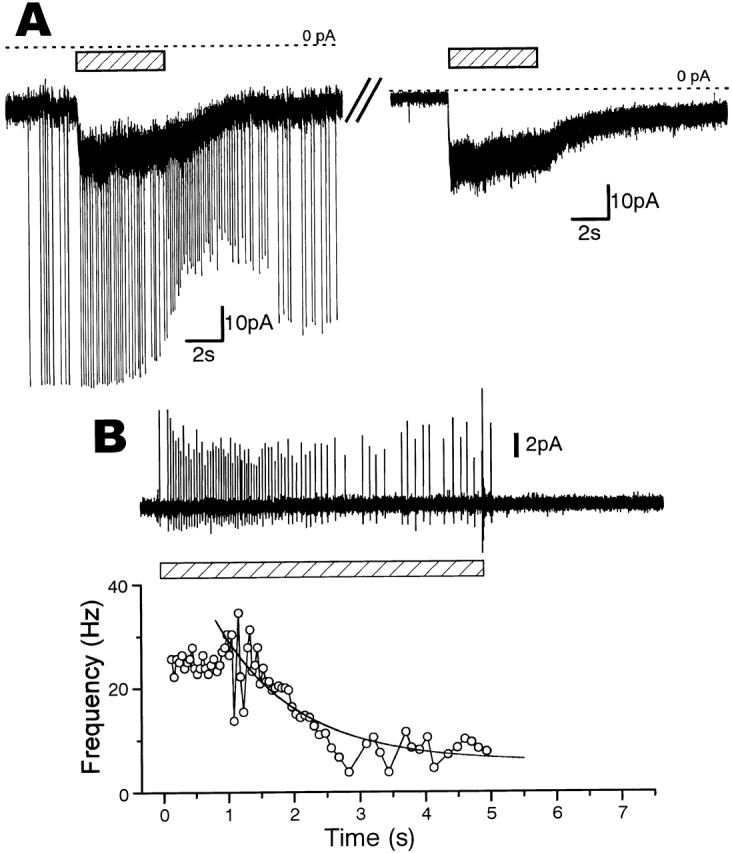
Sucrose-induced responses of sensory processes in the whole-cell, outside-out, and cell-attached mode. (A) An example in which almost the same magnitudes of currents were induced by sucrose (250 mM) in the whole-cell (left) and outside-out mode (right). These traces were recorded successively on the same sensory process voltage clamped at −60 mV. Dotted lines show zero levels of the currents. (B) An increase in impulse frequency induced by puff-application of sucrose (250 mM) to a swollen sensory process. This was recorded by the cell-attached patch-pipette (top). The time course of impulse frequency (reciprocal of the interval between successive impulses) during sucrose application in the top trace (○, bottom). The adaptation time course could be fitted by an exponential term with a time constant of 1.2 s (continuous line). The periods of sucrose application are shown by shadowed bars in A and B.