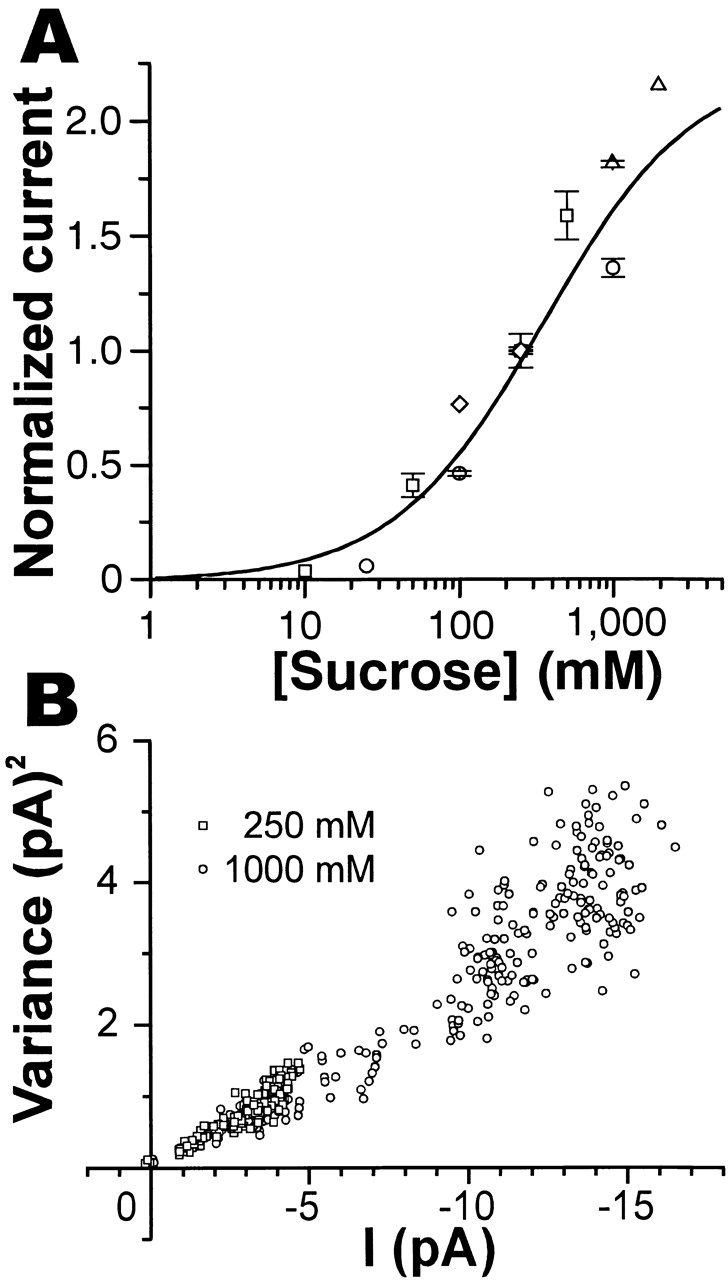
Figure 5.

Dose–current and current–variance relationships of the sucrose-induced current. (A) A dose–current curve for sucrose. Sucrose-induced currents for various sucrose concentrations were normalized to the current at 250 mM sucrose in each outside-out patch voltage clamped at −60 mV (n = 5), and the relative magnitudes of the induced currents were plotted. Each point represents an average current (±SEM) that was in steady state for more than 1 s. Points with different symbols were obtained from different patches. Points without error bars indicate a single observation. Data were fitted by a Michaelis-Menten equation (a Hill equation with n = 1, see text) with K b = 271 mM (continuous curve). (B) A plot of variances of current fluctuation against the mean currents obtained from two current records induced by 250 mM (□) and 1 M (○) sucrose, respectively, on the same outside-out patch. Net variances were calculated in each 50-ms period after the start of sucrose application, including the rising phase of current after the start and the falling phase after the end of sucrose application, and plotted against net amplitudes of the sucrose-induced current. Therefore, sucrose concentrations may be the same as the applied concentrations only around the peaks of sucrose-induced currents (∼4.5 pA at 250 mM and ∼15 pA at 1 M sucrose), but lower at smaller currents. Sucrose was applied for 5 s in each trial.
