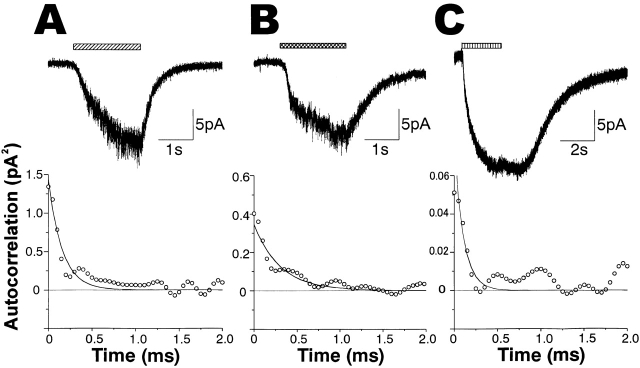
Figure 8.
Responses of sensory processes of the sugar receptor cells to fructose and L-valine. (A) An inward current induced by 250 mM sucrose in an outside-out patch at −60 mV (above) and its autocorrelation function (below). The autocorrelation function was fitted by a single exponential curve with a time constant of 0.31ms. (B) An inward current induced by 250 mM fructose at −60 mV (above) and its autocorrelation function fitted by an exponential term with a time constant of 0.61 ms (below), obtained from the same patch as in A. (C) A current induced by 50 mM L-valine at −60 mV (above) and its autocorrelation function fitted by an exponential term with a time constant of 0.11 ms (below), obtained from a different outside-out patch to that in A and B.

