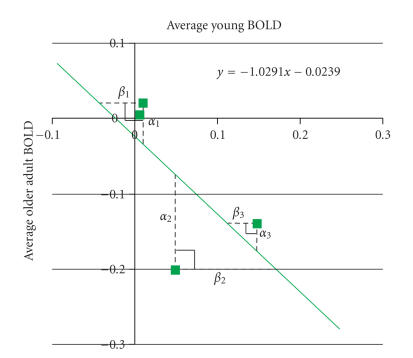
Figure 1.
Representative voxel illustrating testing of the null hypothesis (H0 : ). To assess whether the null hypothesis is true in any given voxel, a t-test comparison of the and residual values was used. When , then the line was not significantly close to one and the voxel was considered to have a significant deviant slope. If the T value survived the correction for multiple comparison (3 contiguous voxels where FWE < 0.05), the respective brain area was considered to be a loci for general cognitive slowing. A second analysis is needed to identify areas where voxels with slopes of −1 were eliminated in the residual analysis.

