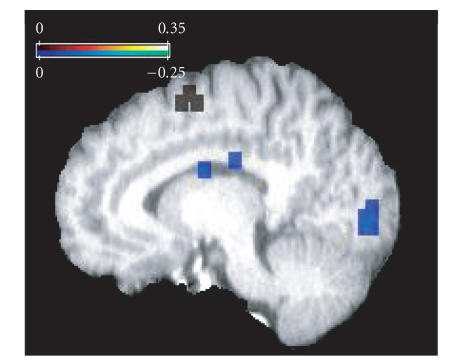
Figure 6.
B-intercept map for Peiffer plot at mm. Cool-colored voxels show negative b-intercept values where older adults have lower activity than younger adults. Note the large cluster within the occipital area. Warm-colored voxels indicate positive b-intercepts where older adults show greater activity than younger adults. Interestingly, several contiguous voxels were identified within right motor cortex and indicated increased bilateral activity in older relative to younger adults across the 4 detection tasks.

