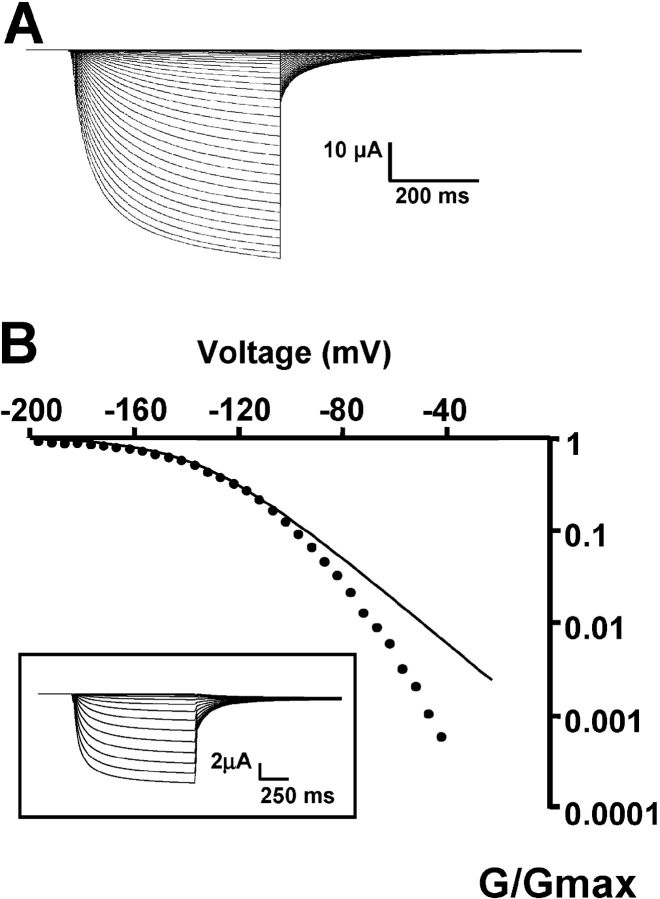
Figure 1.
KAT1 ionic currents recorded using the cut-open oocyte voltage clamp technique under symmetric 110 mM KMES. (A) KAT1 ionic currents were recorded in response to 1-s voltage steps from −85 to −250 mV in 5-mV increments followed by a step to −40 mV. Holding potential was 0 mV. This is the amount of KAT1 channel expression needed to detect KAT1 gating currents as described in the text. (B) Voltage dependence of the activation of KAT1 channels. The conductance-voltage curves were obtained using tail current measurements (inset). Solid line is a fit to the normalized conductance (G/G max) − V data to a Boltzmann function as explained in materials and methods. V1/2-G = −139 mV and zG = 1.31.

