Figure 3.

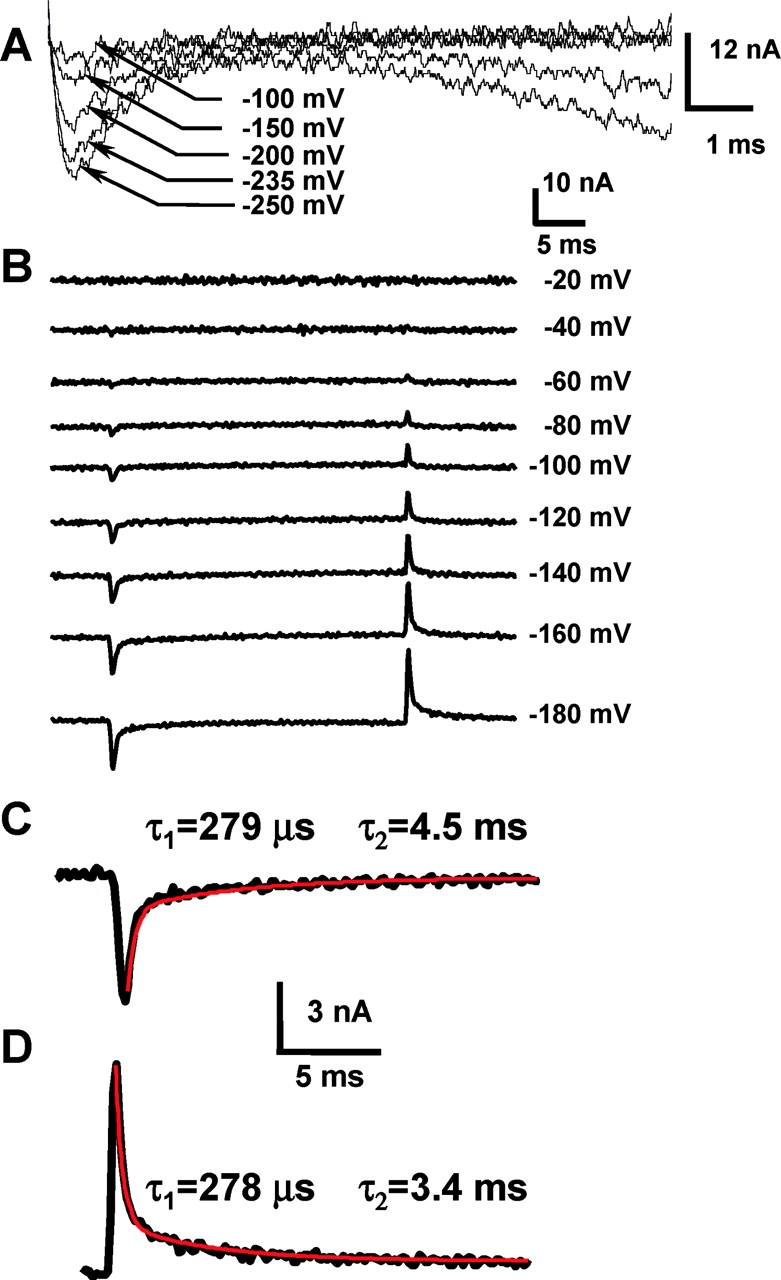
Gating currents induced by KAT1 channels. (A) Gating and ionic currents recorded in K+-free internal solution, 10 mM external K+, after a step depolarization to the indicated voltages. Holding potential was 0 mV. (B) A family of gating current records evoked in response to 30-ms voltage pulses, from a holding potential of 0 mV, in K+-free solutions. Notice that gating currents are apparent at −60 mV, a voltage at which the probability of opening is <0.01 (see Fig. 1 B). (C) ON gating currents measured at −180 mV, red line is a biexponential fit with the indicated fast and slow time constants. (D) OFF gating currents measured at 0 mV, after a 30 ms −180 mV pulse. Red line is a biexponential fit with the indicated fast and slow time constants.
