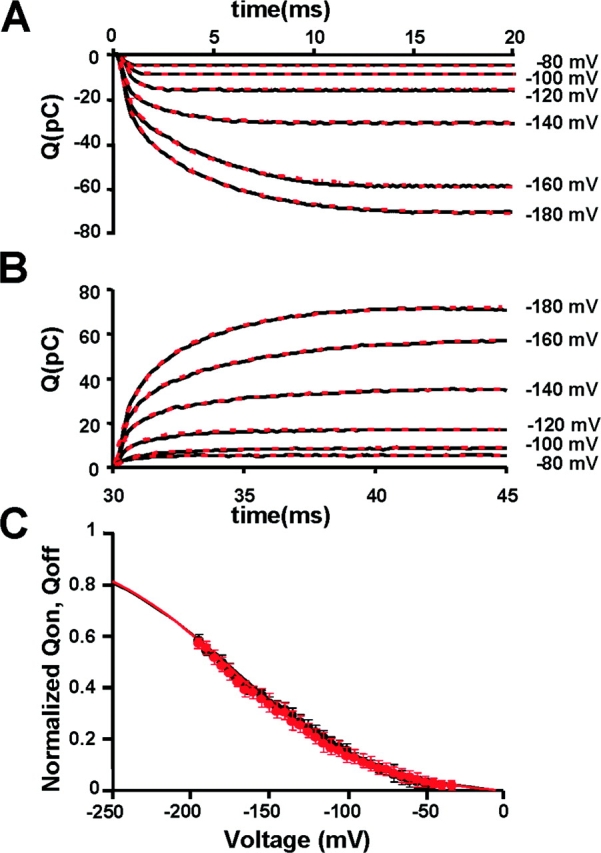
Figure 4.

Properties of KAT1 gating currents. (A) Gating charge calculated as the time integral of the ON gating currents shown in Fig. 3 B. (B) Gating charge calculated as the time integral of the OFF gating currents shown in Fig. 3 B. Between −80 and −120 mV the gating charge time course is well described by a single exponential fit with a time constant of the order of 300 μs. Between −140 and −180 mV, a biexponential fit is necessary to account for the gating charge time course. (C) Comparison between normalized Q ON and Q OFF. Data was fitted using Eq. 2 with: zg − ON = 0.56 ± 0.10, V1/2 − QON = −176 ± 9 mV; zg − OFF = 0.57 ± 0.15, V1/2 − QOFF = −172 ± 10 mV (n = 5).
