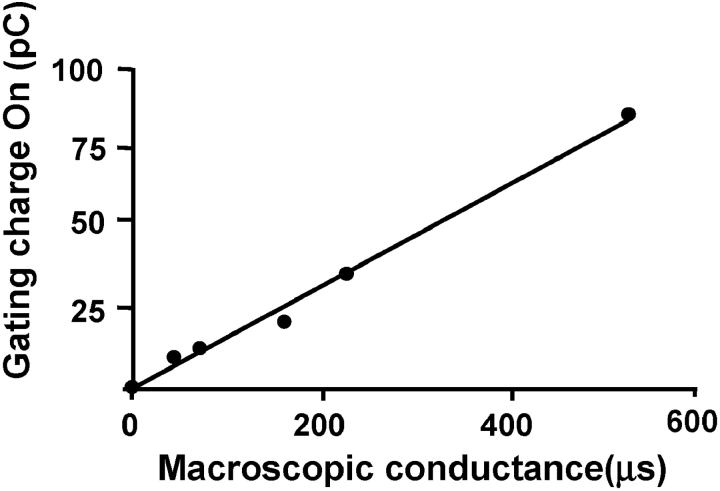
Figure 5.
Proportionality between gating charge and KAT1-induced K+ conductance. Each point represents a different oocyte in which the ionic conductance and gating currents were measured at −180 mV. K+ currents were measured in the presence of 110 mM K-MES in the external side, which was subsequently replaced by 110 mM NMG-MES when measuring gating currents. Gating charge was obtained integrating IgON.

