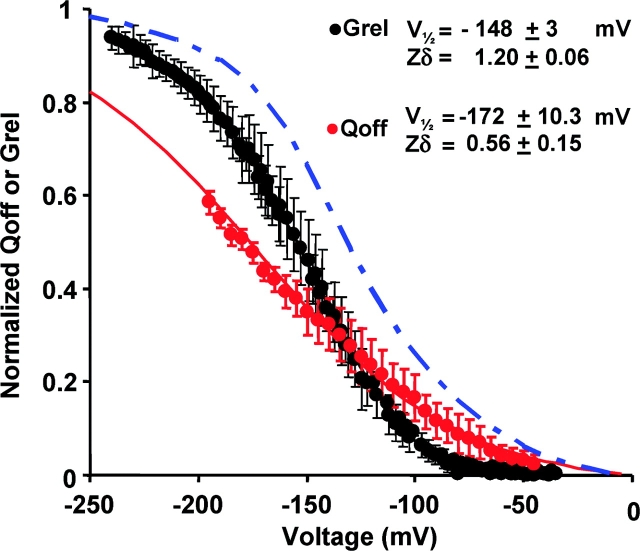
Figure 6.
Normalized voltage-activation curves for gating (Q OFF, red circles) and ionic currents (G/G max, black symbols). Conductance and QON data points were fit to Boltzmann functions as described in materials and methods. V1/2 − G = −148 ± 3 mV and z = 1.20 ± 0.06 (n = 13). V1/2 − Q = −172 ± 10 mV and zQ = 0.57 ± 0.15 (n = 8). The solid blue line is the predicted Q-V curve for the KAT1 using the voltage-dependent rate constants for Scheme I given by Zei and Aldrich (1998).

