
Figure 2.
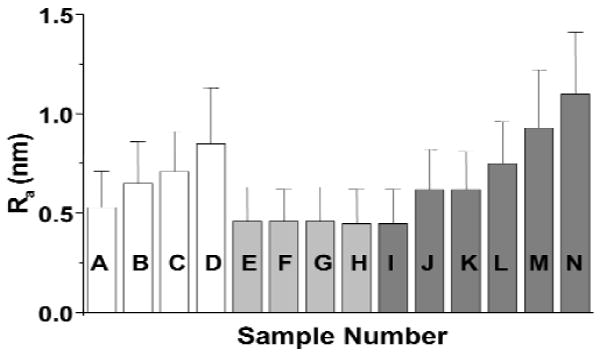
Surface roughness measurements (Ra ± SD) of maturation-stage enamel crystals after in vivo or in vitro treatment of fluoride. In vivo treatment (rats received systemically different concentrations of fluoride in their drinking water, added as NaF, for 21 days): A (control), B (25 ppm), C (50 ppm), D (75 ppm). [B and C are not significantly different from each other (P < 0.05).] Maturation-stage enamel crystals treated in vitro with NaF at different concentrations for 21 days at 37°C: E (control), F (25 ppm), G (50 ppm), H (75 ppm) [not significantly different from each other (P < 0.05)]. Maturation-stage enamel crystals treated in vitro with NaF in different concentrations for 18 hrs at 37°C: I (control), J (200 ppm), K (1000 ppm), L (2000 ppm), M (10,000 ppm), N (20,000 ppm) [J, K, L, M, N are significantly different from the control, I; J and K are not significantly different from each other but are significantly different from L, M, N; L, M, N are significantly different from each other (P < 0.05)].