
Figure 4.
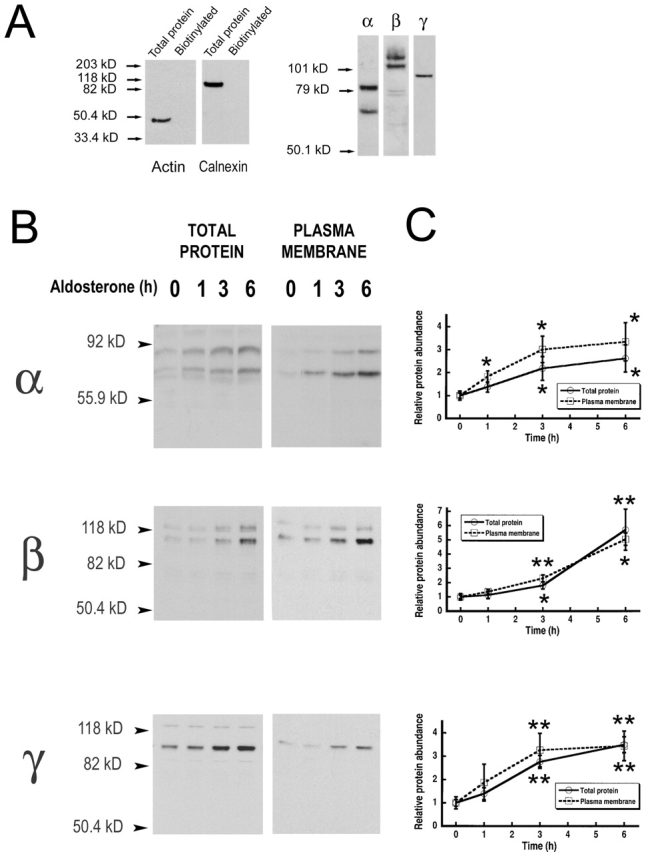
Steady-state levels of total and cell surface ENaC subunits. (A) A6 cells apical plasma membrane proteins were biotinylated, recovered from cell lysates with streptavidine beads, and analyzed by Western blot with antibodies against actin, calnexin, and xENaC subunits. Actin and calnexin blots include a lane with an extract of total proteins and a lane with biotinylated protein. (B) A6 cells were treated for indicated times with 100 nM aldosterone followed by apical biotinylation. Aliquots of cell lysates containing 20 μg of protein were analyzed by Western blot with anti–xENaC antibodies (total protein). Biotinylated proteins were recovered with streptavidine-agarose beads and analyzed by Western blot (plasma membrane). Representative experiments are shown for each subunit. (B) Time course of the change in abundance of total (circles) and surface (squares) subunits examined by scanning densitometry. Each data point represents the mean ± SE of five experiments. Student's t tests were used to compare the value at each time point with the value at 0 h. Asterisks above dotted line refer to plasma membrane values. Asterisks below solid line refer to total protein values. *, P < 0.05; **, P < 0.01.