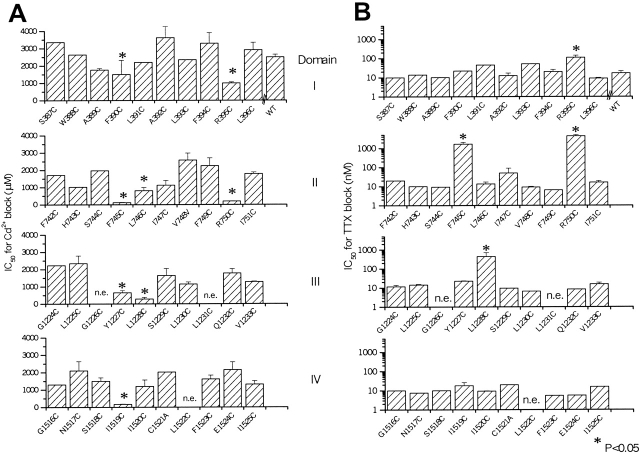
Figure 2.
The effect of external Cd2+ and TTX on the cysteine substitution mutants on the NH2-terminal side of putative selectivity filter in μ1. (A) Bar plot of the IC50s for Cd2+ block of each of the mutants that express current. The mutants R395C, R750C, L746C, F745C, Y1227C, L1228C, and I1519C have IC50s (mean ± SD) 999 ± 64, 201 ± 10, 813 ± 10, 123 ± 19, 650 ± 106, 292 ± 94, and 173 ± 19 μM (P < 0.05 versus WT, 1,955 ± 207 μM), respectively. (B) Bar plot of the IC50s for TTX of each of the mutants that express current. The mutants R395C, F745C, R750C, and L1228C have IC50s for TTX block of (mean ± SD) 112 ± 32, 1,660 ± 425, 4,431 ± 661, and 441 ± 268 nM (P < 0.05 versus WT, 13 ± 4 nM), respectively. In cases without standard error bars, full dose–response curves were obtained in individual cells, and the lack of deviation from wild-type was confirmed in several other experiments using single doses of Cd2+ (0.5 mM) and TTX (50 nM).

