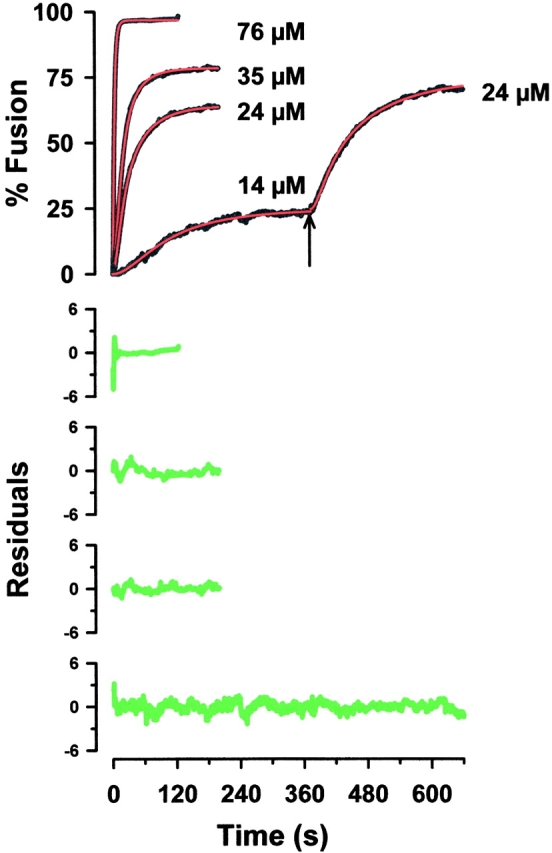
Figure 1.

Typical fusion curves resulting from single and double challenge experiments at four different calcium concentrations are represented (14, 24, 35, and 76 μM). The data were collected using a sample time of 0.1 s The second fusion curve of a double challenge experiment was fit piecewise using a modification of the model. A fourth scaling parameter was used to represent the extent of fusion at the time of the second challenge. The data are black, the fitted curves are red, and the difference between the two (residuals) is green.
