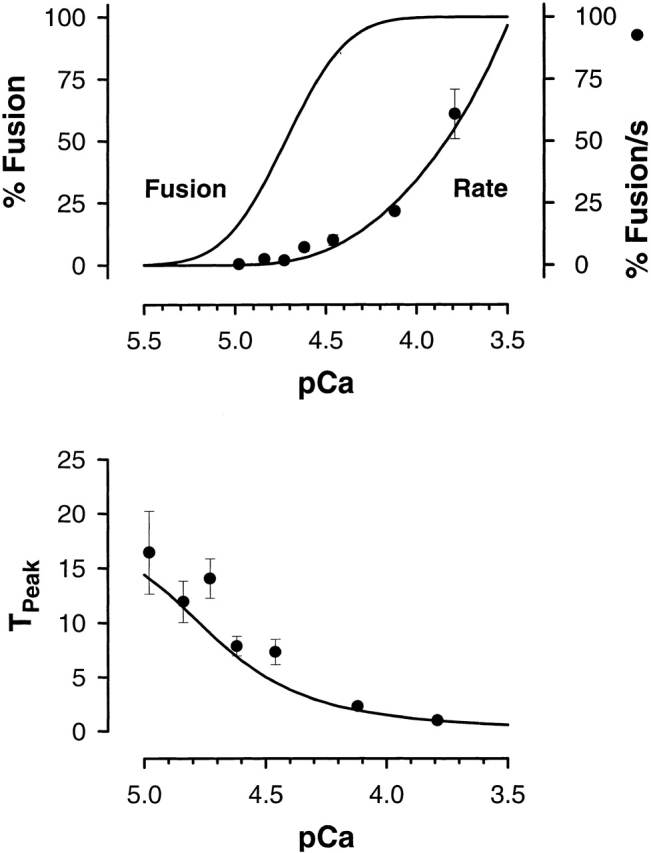
Figure 3.

The maximum fusion rate and the time to reach the maximum rate (TPeak) vary with calcium. Using the relationship between the extent of fusion (pCa and n), the experimentally derived constants for α, and the correlation between n and p, specifies the kinetic response as a function of calcium. The solid lines indicate these relationships, in agreement with the observed behavior of both the maximum rate and the time to reach the maximum rate.
