
Figure 5.
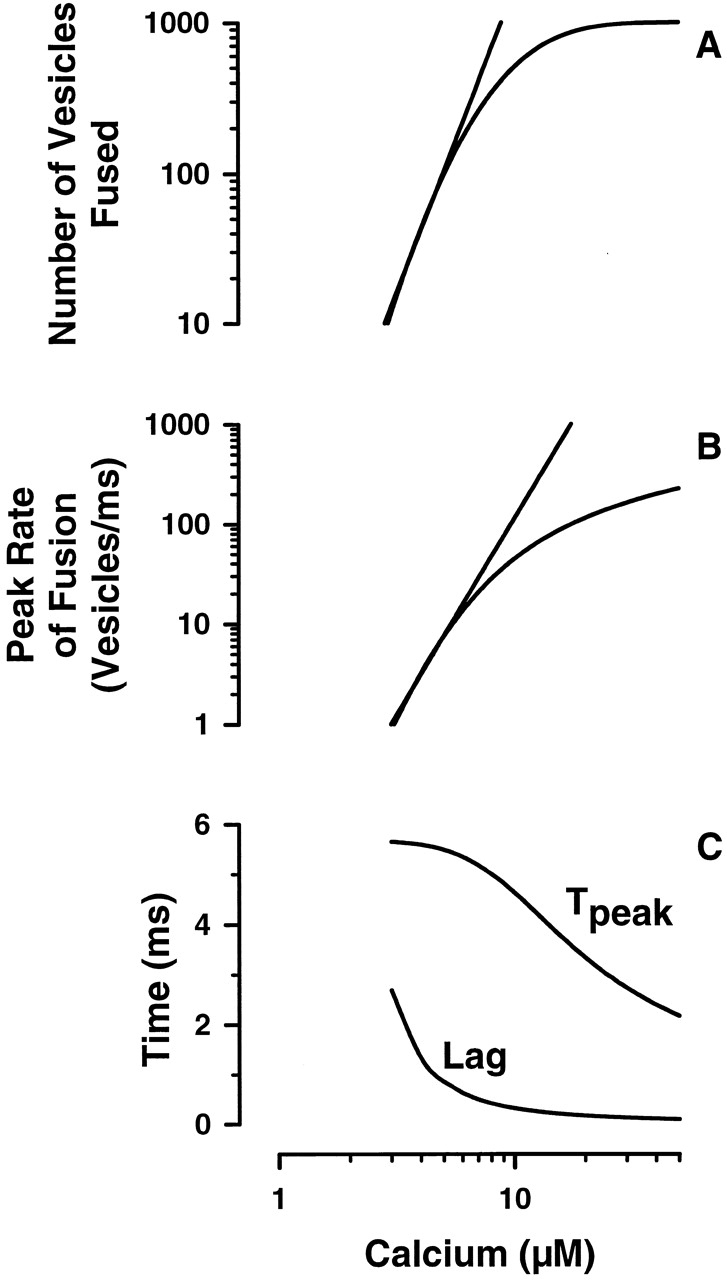
A and B are the log-log representations for the calcium dependence of the extent and maximum fusion rate predicted for the neuronlike system with τα = 10 ms and τP = 7 ms. The n-calcium relationship was established using midpoint M = 10 μM and width W = 0.23 in the cumulative log-normal distribution. The straight lines are nth order fits to the linear portions of the curve (3–7 μM calcium); the extent and maximum rate are approximated by [Ca2+]4.0 and [Ca2+]3.9, respectively. C is the predicted calcium dependence for the time of the first fusion event (Lag) and the time to reach the maximum rate (Tpeak).