
Figure 3.
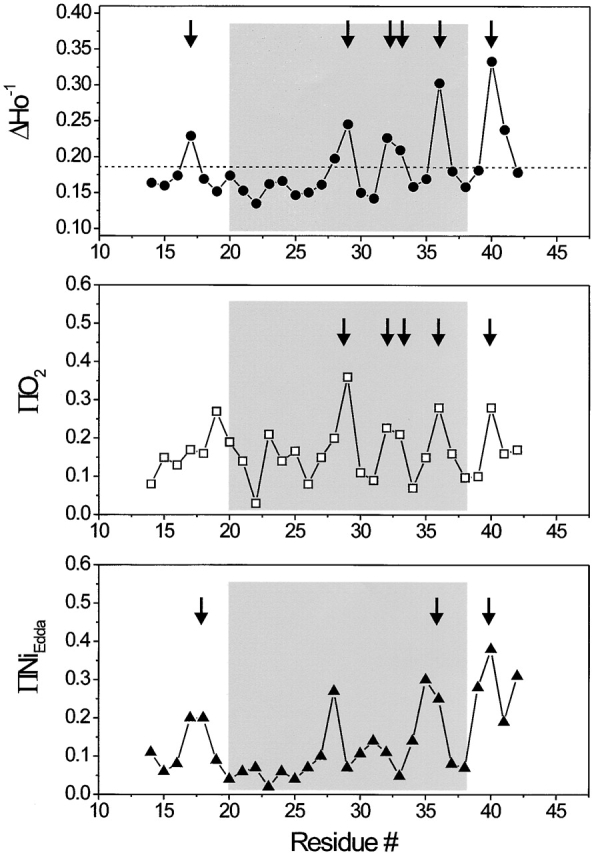
Residue-specific environmental parameter profiles obtained for the first transmembrane domain TM1: mobility parameter ΔH0 −1 (top, closed circles), oxygen accessibility parameter ΠO2 (middle, open squares), and NiEdda accessibility parameter ΠNiEdda (bottom, closed circles). The average mobility for the entire segment is shown in the top panel as a dotted line. Arrows point to those residues with in-phase accessibility and/or probe mobility peaks.