
Figure 6.
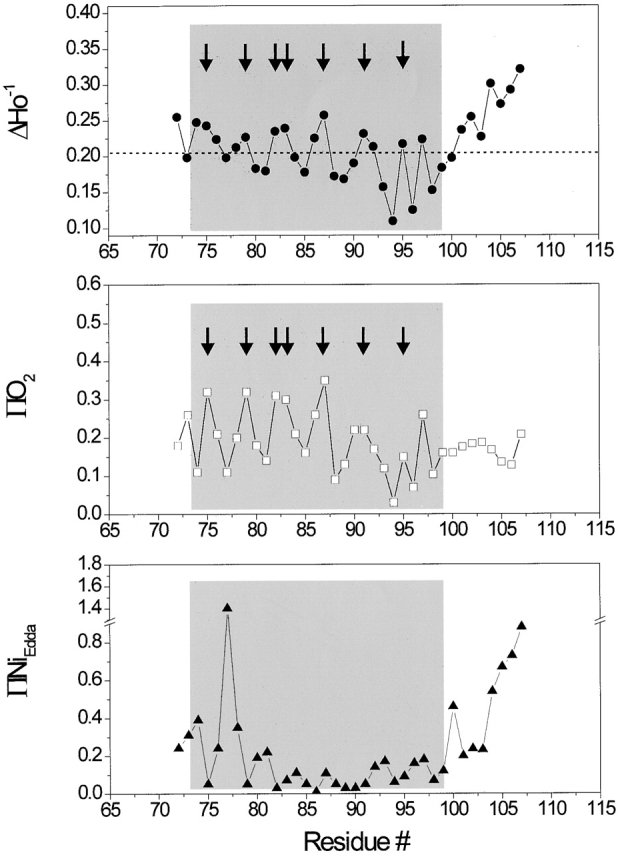
Residue-specific environmental parameter profiles obtained for the second transmembrane domain TM2: mobility parameter ΔHo −1 (top, closed circles); oxygen accessibility parameter ΠO2 (middle, open squares); and NiEdda accessibility parameter ΠNiEdda (bottom, closed circles). The dotted line in the top panel represents the average ΔHo −1 value for the entire segment. Arrows point to those residues with in-phase accessibility and/or probe mobility peaks.