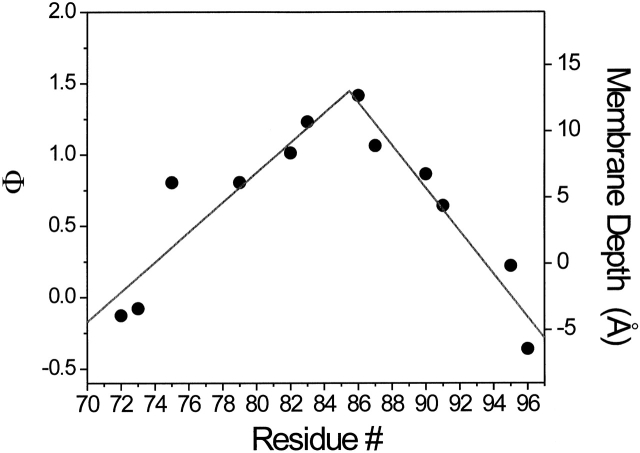
Figure 8.
Immersion depth for exposed residues in TM2. Individual data points were calculated from a calibration curve of spin-labeled phospholipids following the equation Φ = ln(Π(O2)/Π(NiEdda)) = αD + C, where Π(O2) and Π(NiEdda) are accessibility parameters for O2 and NiEdda, respectively, α is the slope, D is the immersion depth, and C is the intercept. Positive distances indicate immersion toward the center of the bilayers, relative to the membrane interface. Negative values have a very large uncertainty associated and are shown for reference purposes.

