
Figure 9.
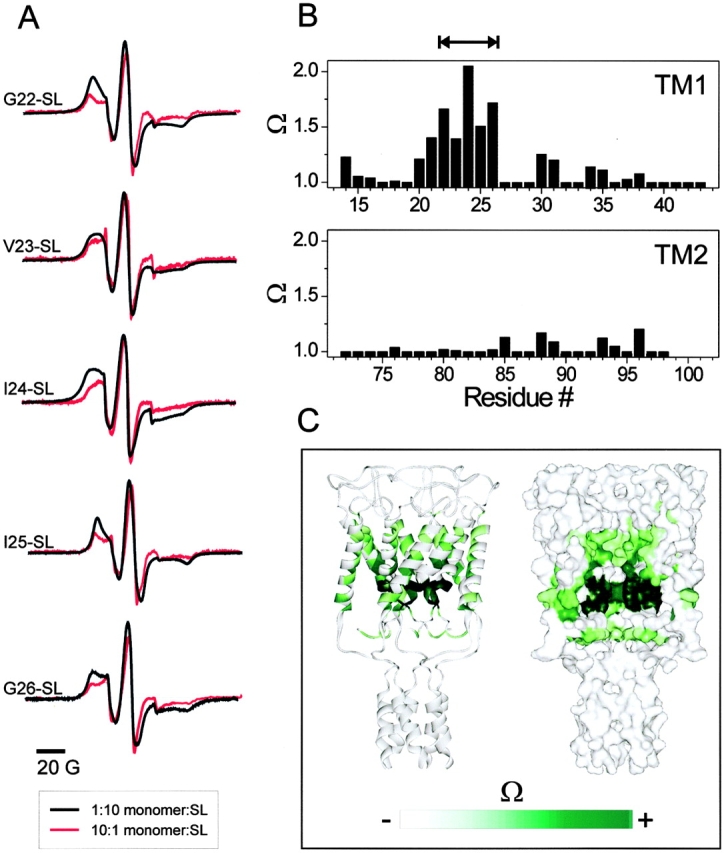
Intersubunit electron spin–spin coupling in MscL. (A) selected residues along TM1 showing different degrees of spectral broadening due to spin–spin coupling. Traces in black were obtained from fully labeled channels (mole/mole labeling ratio, 10:1 spin label/subunit). Traces in red were obtained from underlabeled channels and represent unbroadened spectra (mole/mole labeling ratio, 1:10 spin label/subunit). (B) Pattern of intersubunit proximities derived from the Ω parameter (top, TM1; bottom, TM2). The double arrow line points to a stretch of hydrophobic residues with restricted mobility. (C) Data in B as mapped onto the equivalent positions in the Tb-MscL structure.