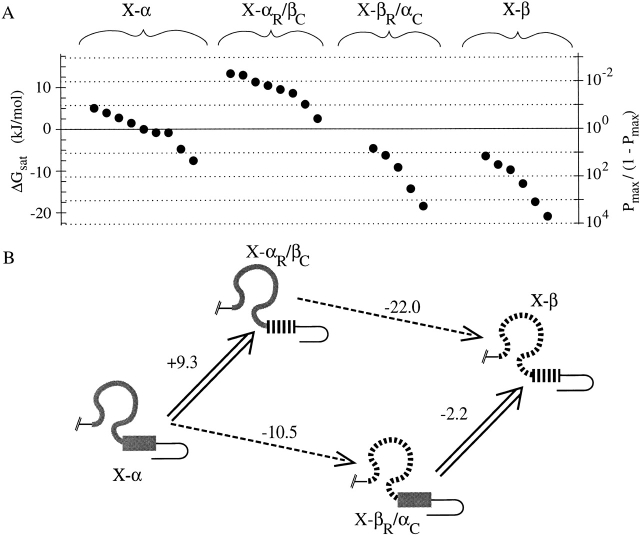
Figure 8.
Analysis of cAMP activation data for chimeras using a thermodynamic linkage cycle. (A) Efficacies of cAMP activation for all single-channel patches in this study are plotted using the same axes as in Fig. 6 A; each solid point plots data obtained from an individual patch from a distinct oocyte. (B) BDs of four chimeras arranged at the corners of the linkage cycle. Wide arrows represent replacements of fCNG2 C-helix by rCNG5 C-helix; dashed arrows represent replacements of fCNG2 roll subdomain by rCNG5 subdomain. For each replacement, ΔΔGsat,cAMP (defined as the change in ΔGsat,cAMP that results from performing that replacement) is shown, in units of kJ/mol. The independence hypothesis fails because parallel sides of the cycle have different values of ΔΔGsat,cAMP.

