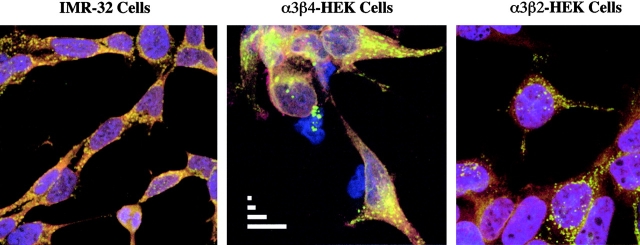
Figure 11.
Confocal microscopy of α3 AChRs expressed by IMR-32 neuroblastoma cells and HEK cells transfected with α3β4 and α3β2 AChRs. Cells were plated, fixed, permeabilized, and labeled as described in materials and methods. For each cell type, green reflects labeling of α3 subunits by Alexa 488-labeled mAb 210. For IMR-32 cells and α3β4 cells, red reflects secondary labeling by Alexa 568-labeled GAM antibody against mAb 337 which bound β4 subunits. For α3β2 cells, red reflects secondary labeling by Alexa 594-labeled GART antibody against mAb 295 which bound β2 subunits. Yellow is a result of overlap in the labeling of colocalized subunits. For all cells, ToPro-3 iodide (blue) was included as a nuclear counterstain. The scale bars in the α3β4 panel represent 1, 2, 5, and 10 μm, respectively.

