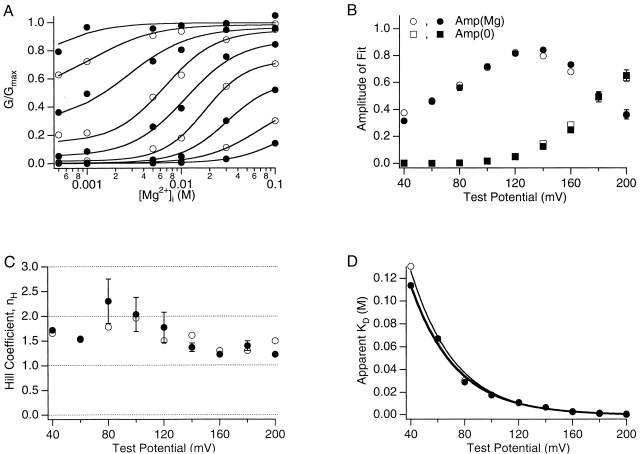
Figure 4.
Mg2+ dependence of mslo1 currents. (A) Average normalized G-V relations at 0 [Ca2+]i and the following [Mg2+]i: 0, 0.1, 0.5, 1, 5, 10, 30, and 100 mM were transformed to dose–response curves as displayed (data at 0 and 0.1 mM [Mg2+]i is not shown on the logarithm scale). Alternating closed and open circles represent the dose–response curves (ascending right to left) at different voltages between 40 and 200 mV in 20-mV increments. Smooth curves represent fits to the Hill equation (G/Gmax = Amp(Mg)/(1 + (K d/[Mg2+]i)nH) + Amp(0)), where nH is Hill coefficient, K d is the apparent Mg2+ dissociation constant, Amp(0) = G/Gmax at 0 [Mg2+]i, and Amp(Mg) is the Mg2+-dependent component of G/Gmax. (B–D) The amplitudes, Hill coefficient, and apparent dissociation constant determined from fits to the Hill equation are plotted versus voltage. Open symbols represent parameters determined from the fits in A. Closed symbols represent the mean values from four experiments. In D, solid lines are fits with the function K d(V) = K d(0)exp(zeV/kT). The thin line fits the results determined in A, K d(0) = 378.8 mM and z = 0.77. The thick line fits the mean results from four experiments, K d(0) = 242.3 mM and z = 0.77.

