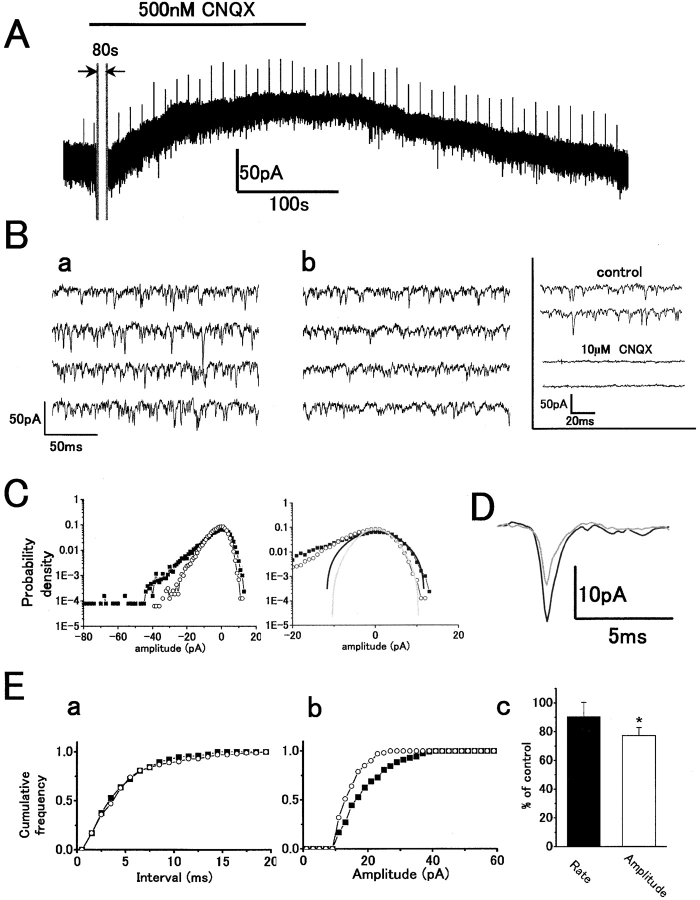
Figure 3.
500 nM CNQX reduced the sEPSC mean peak amplitude in darkness without any change in rate similarly analyzed as in Fig. 2. Symbols: control (filled squares or black traces) and CNQX (open circles or gray traces). (A) Whole-cell voltage-clamp recording from an H1 HC showing an outward current in response to application of CNQX with a reduction in sEPSC amplitude. For illustration, 80 s of the recording was removed. The initial inward current was probably a solution-switching artifact since this was only observed in one out of four recordings. V h = −60 mV. (B) Fast sweep recordings in darkness before (a) and during (b) CNQX application. (C) Gaussian functions in control (σ = 5.0 pA) and with CNQX (σ = 3.4 pA). (D) Time course of averaged sEPSCs before (n = 139) and during (n = 196) CNQX application. (E, a) Cumulative interval histograms in control (n = 222) and with CNQX (n = 157) indicate no significant change of sEPSC rate with CNQX. The mean sEPSC intervals: 4.3 ms (control) and 4.7 ms (CNQX). (b) Cumulative peak amplitude histograms in control (n = 221) and with CNQX (n = 156). Mean amplitude in CNQX (10.5 pA) was reduced compared with that in control (15.7 pA). (c) Summarized bar chart (from four cells). CNQX reduced the sEPSC amplitude by 22.7 ± 0.1%: P < 0.03) but did not change the mean rate (9.5 ± 9.9%: P > 0.4).

