Figure 6.
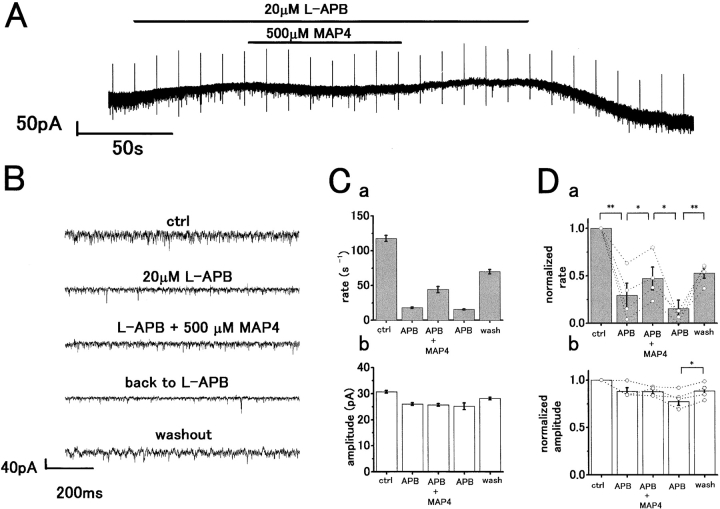
The action of L-APB in reducing sEPSC rate is antagonized by MAP4. (A) Whole-cell voltage-clamp recording from an H1 HC in the dark. 20 μM L-APB induced an outward current accompanied by a reduction in sEPSC rate. Coapplication of 500 μM MAP4 induced an inward current with some recovery of sEPSC rate. A voltage command pulse of 5 mV was applied every 12 s. V h = −57 mV. (B) Fast sweep recording of current traces in each pharmacological condition shown in A. (C, a) Bar chart representation of sEPSC rate under the different pharmacological conditions. MAP4 application partially restored the L-APB induced reduction in sEPSC rate. (b) A similar plot showing little change in sEPSC peak amplitudes. (D) Bar charts summarizing the mean changes in sEPSC rate (a) and peak amplitude (b) from four cells. Open circles with dotted lines indicate individual data from single cells. Levels of significance calculated by paired t test were as follows: (**) P < 0.01; (*) P < 0.05.

